


Focus on technical analyses!
Our ability to discover patterns and correlations in large and complex data sets is a game changer for our market strategies.
Technical Analyses!

Recognise trend directions in the chart.
Using advanced chart analysis techniques, Quantum Data Analytics provides deep insights into market dynamics to precisely identify critical turning points and trend lines.
At Quantum Data Analytics, we enhance traditional chart analysis by incorporating cutting-edge regression analysis techniques. This advanced approach enables us to deliver a more comprehensive and precise understanding of current market conditions. By merging regression analysis with time series analysis, we pinpoint key chart features, allowing us to identify support and resistance levels with greater accuracy. This method defines meaningful price zones, leading to more significant and accurate market forecasts. Our strategies are built on a diverse set of indicators, which we expertly identify using artificial intelligence and seamlessly integrate into our market analyses.

Prices are not just random events. By studying past price movements, we can recognise patterns and trends that help us to predict future price movements.

1
Time Frames
Our technical analysis begins with the 4-hour chart and extends up to the weekly chart. While we also take smaller time frames into account to gain a comprehensive view of the market, we do not publish these shorter intervals, as their fast-moving nature makes them less reliable. However, all time frames must align to ensure well-informed decision-making.
2
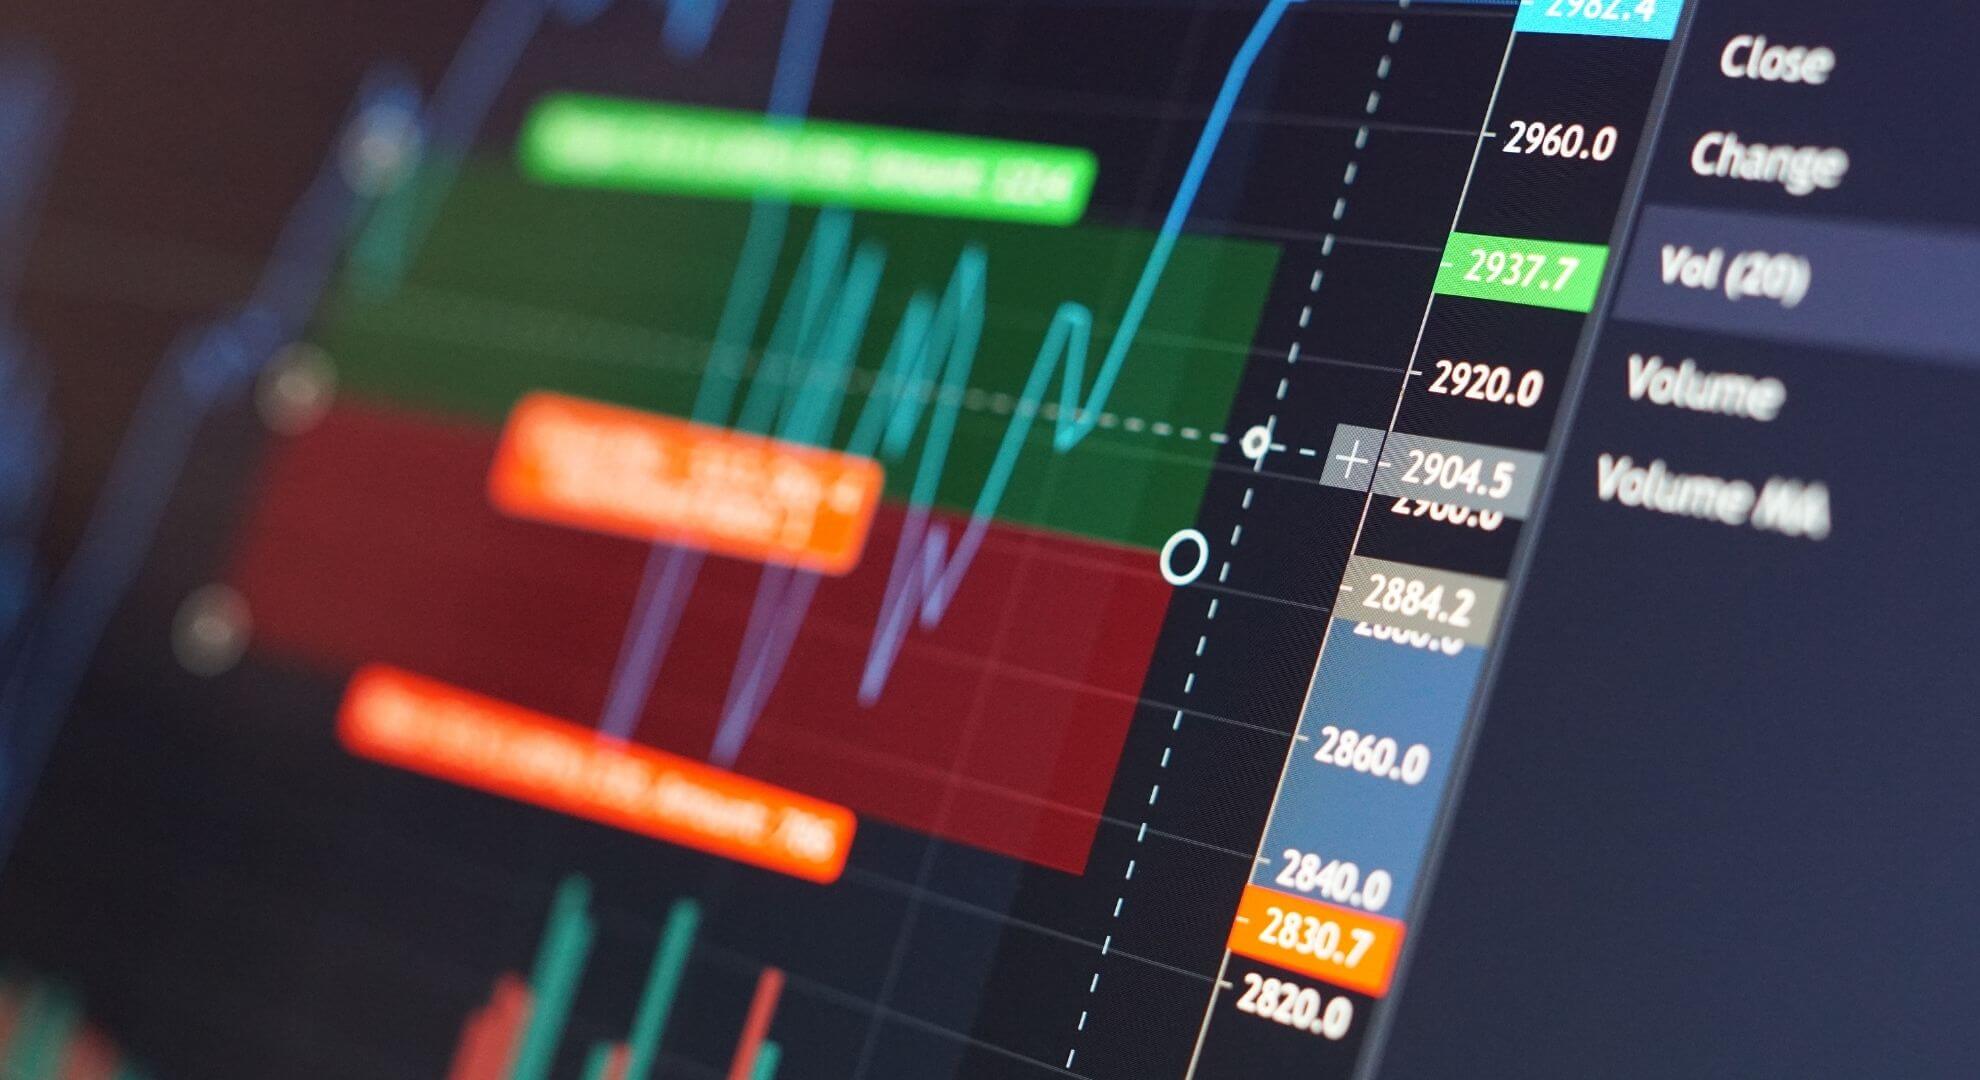
Price Zones
We identify price zones through regression analysis, which reveals key support and resistance levels. These zones are critical as they reflect areas of high trading interest. Prolonged activity within these zones may also signal potential trend reversals. By accurately pinpointing these zones, market movements can be predicted more effectively, enabling optimization of trading strategies. The price zones are color-coded, with support zones marked in green and resistance zones in red.

3
Fibonacci-Retracements
Fibonacci retracements are integral to both our analyses and trading bots, as they capture a critical psychological component of market behavior. These retracements highlight key support and resistance levels during price movements, helping to identify potential market highs and lows. By incorporating Fibonacci retracements, we can more accurately assess price corrections and trend continuations, enabling us to make informed trading decisions and manage risk more effectively.
4
Indicators
For our trading, we use important indicators for our analyses as well as for our trading robots, which have already achieved one of the most important positions in stock exchange trading over the years due to their reliability. These include a large number of momentum indicators as well as oscillators. To ensure that we receive the data in real time, we have developed our own indicators, which hardly differ from the indicators on the trading centres. We also use artificial intelligence to identify the best indicators depending on the market situation.
5
On Chain
In order to be able to assess the various market situations in real time, we also use on-chain data in our analyses. We also use the on-chain data for our regression analyses in order to gain an improved view of the markets. By integrating this on-chain data into our analyses, we can directly mirror supply and demand with the quantitative data and draw a more in-depth picture than conventional chart analyses.
One example of this is analysing asset transfer activity. If assets are increasingly being transferred from private addresses to trading centres, this indicates that the sell side is increasing and selling pressure can be expected soon. Conversely, if assets are withdrawn from the stock exchanges, the reserves on the trading centres decrease, which could lead to increased buying pressure if the buying mood is right.
On the road to success with Quantum!
Utilise your contacts and networking skills and turn them into a permanent and growing source of income! Let us grow together and benefit from the strength of our offer.
Learn More! arrow_forwardAdditional income that grows with you!
Turn your contacts into cash!
Do you have a network of potential investors or the talent to establish such contacts? Then we have an attractive opportunity for you!
Private Success Cluster
Offer your network something exclusive!
We develop individual programmes exclusively for you and your clients, which are only accessible through your mediation. You benefit continuously as long as your client uses our service.
Professional success cluster
Your content for long-term revenue!
Benefit from permanent commissions for every user you refer. Your commission grows with your success, as the market for automated exchange trading is booming. Utilise this potential for your content and integrate our platform into your articles.