OUR
STRATEGY
Stability in volatility
Our overarching goal is to generate an average monthly return of +3%.
This goal is based on many years of development and continuous optimization of our algorithmic trading logic.
Especially in a volatile market environment, it requires clear strategies, realistic target values, and disciplined execution. Our systems are designed to react flexibly to market changes—with transparency, risk control, and measurable parameters.
IT STARTS WITH A GOAL!

Long-term success in trading digital assets is based on sustainable strategies and their effective implementation.
Our strategy does not pursue short-term, high-risk gains, but rather aims for long-term, achievable returns through structured, fully automated trading.
To achieve this, we rely on intelligent trading robots that are programmed to detect market sell-offs early. During such phases, they act proactively: open positions are systematically closed to minimize potential losses. The systems then continuously monitor the market and patiently wait for a stable market environment before becoming active again.
Through this structured approach, our systems are designed to enable efficient market positioning at all times – around the clock, as long as the trading logic is active.
Note: Automated trading is subject to market fluctuations and can lead to losses despite risk management. The strategy presented is not a guarantee of future results.
Our algorithmic trading strategies are continuously adapted to the respective market conditions. We use specialized trading robots that are able to act in a structured way in both upward and downward trends.
In bull markets, the focus is on optimizing profit-taking—strategies are configured to set stop-loss orders more generously to allow room for positive price developments.
In bear markets, on the other hand, the strategies are more conservatively aligned: profit targets are defined more cautiously, while stop-loss limits are set more tightly to limit potential losses early.
With a variety of algorithmic systems in use, we are able to respond to a wide range of market phases in a reactive and structured manner—always within defined risk parameters.
Strategy with foresight – Recognize opportunities, manage risks
Our experience has taught us: A clear, transparent, and well-founded strategy is crucial.
At the core is always a balanced relationship between opportunity and risk – because only those who understand and control risks can profit sustainably.
This fundamental attitude shapes our daily work. We leverage attractive return opportunities without losing sight of risk hedging. Our strategies are based on many years of market experience, deep expertise, and the ability to react quickly and precisely to changes.
Our focus is particularly on macroeconomic indicators, above all the monetary policy of leading central banks.
Through multidimensional correlation analyses – for example, between money supply, inflation, and global financing conditions – we recognize market-relevant shifts early and adjust our algorithms accordingly.
Dynamics meet structure. Intelligence meets discipline.
That is our strategic aspiration.
Die Qualität des Vermögenswerts ist dabei von grundlegender Bedeutung für unseren Ansatz. Unser Fokus liegt auf Vermögenswerten, die nicht nur über eine große Community verfügen, sondern vor allem durch ihre Technologie Lösungen für bestehende Herausforderungen bieten. Phänomene wie „Meme Coins“ oder „NFTs“ (Non-Fungible Tokens) entsprechen nicht unserem Handelsprofil und werden von uns daher nicht in den Handel einbezogen.
The quality of the asset is of fundamental importance to our approach. Our focus is on assets that not only have a large community but, above all, offer solutions to existing challenges through their technology. Phenomena such as "Meme Coins" or "NFTs" (Non-Fungible Tokens) do not correspond to our trading profile and are therefore not included in our trading.
Intelligent market analyses based on data, sentiment, and structure
A central component of our analysis is the sentiment evaluation in social networks.
With the help of specially developed filters based on machine learning, we capture the current market sentiment in real time. This allows us to identify trends, shifts in opinion, and emotional market impulses early—and integrate these insights specifically into our strategies.
To supplement and validate this sentiment data, we rely on further structured analysis sources:
on-chain data,
quantitative pattern recognition,
as well as classic technical indicators.
This combination allows us a multi-layered view of the market—beyond short-term signals.
A special tool in our repertoire is the regression-based deep analysis, which gives us three-dimensional insights into price movements and their dynamics.
Additionally, we use Moving Averages to identify well-founded entry and exit points.
These key figures are continuously refined by learning algorithms and optimized for various market scenarios.
Our analyses are not based on gut feeling—but on data, structure, and adaptive intelligence.
Market Analyses
In our market analyses, we try to convey an overall impression.
AHEAD of the market!

Our market analyses are profound and are based on well-founded industry-specific instruments as well as exclusive fundamental analysis techniques.
They cover a wide range of areas. In addition to using classic chart techniques, we also turn to regressive deep analysis. With the use of machine learning, we generate precise price predictions and, with the help of time series models, capture the seasonal fluctuations in the market.
The market analysis includes various aspects such as technical indicators, regression-based moving averages, and data that indicate the liquidity of an asset, such as open interest. When collecting data, we not only use information that comes directly from the assets themselves but also take external sources into account. These include renowned analysis centers like CryptoQuant and Glassnode, whose data are incorporated into our comprehensive market analysis.
Our Strategy: Recognize Opportunities, Manage Risks
Our experience has taught us:
Sustainable success in the capital markets requires a clear, transparent, and well-thought-out strategy.
At the center of our work is always a balanced opportunity-risk ratio – because only those who keep both in view can succeed in the long run.
This principle allows us to specifically leverage attractive return opportunities while simultaneously taking measures to recognize, limit, and actively manage potential risks early on.
Our strategy is based on three pillars:
Experience and market knowledge
We rely on well-founded, years of expertise in algorithmic analysis and trade execution.Continuous market observation
Through the permanent evaluation of market data and behavioral patterns, we react quickly and purposefully to new developments.Data-based risk models
Our technology allows us to recognize and simulate complex relationships and translate them into intelligent trading decisions.
Macroeconomics as a Pacesetter
An essential part of our work is the observation and evaluation of macroeconomic indicators – with a special focus on the monetary policy of central banks.
We analyze, among other things:
Changes in the money supply (M2/M3)
Development of inflation rates
Adjustments of refinancing conditions and key interest rates
Through the correlation analysis of these factors, we can deduce what effects monetary policy decisions have on the capital markets – and align our trading strategy accordingly.
Technical Indicators
Technical indicators show the current sentiment, which plays a strong role in trading!
FOLLOW THE SIGNALS!

Data-based Market Structure Analysis in Three Dimensions
Our algorithmic models generate a three-dimensional, logarithmic price history, which maps the prevailing market dynamics within a clearly defined evaluation period.
This allows us to identify patterns, tension zones, and volatility clusters before they manifest in market behavior.
To support and supplement this modeling, we work with moving averages, which are based on the principle of supervised learning. This allows these indicators to be continuously adapted to new data and refined in the context of current market cycles.
These methods serve for the structural analysis and visualization of historical data. They do not constitute a trading recommendation and do not guarantee future market development.
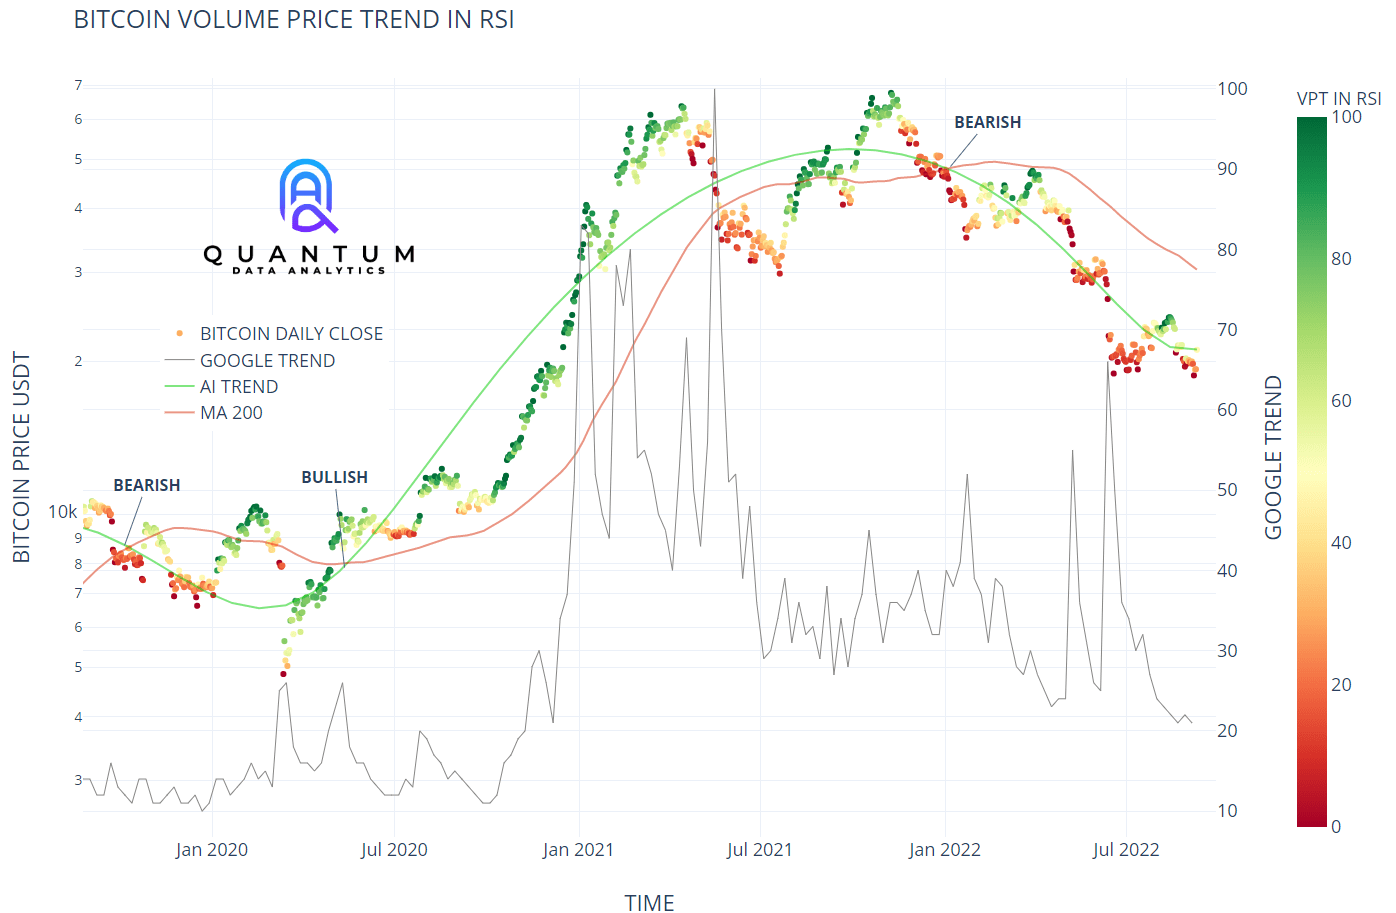
Our regression models use colors in a decisive way, as they represent market sentiment. The color intensity correlates with the confirmation of the trend: a stronger color signals a pronounced trend. Furthermore, the colors can represent potential trend reversal points, which often serve as valuable indicators for buying or selling opportunities. This method is used with great success in our trading robots.
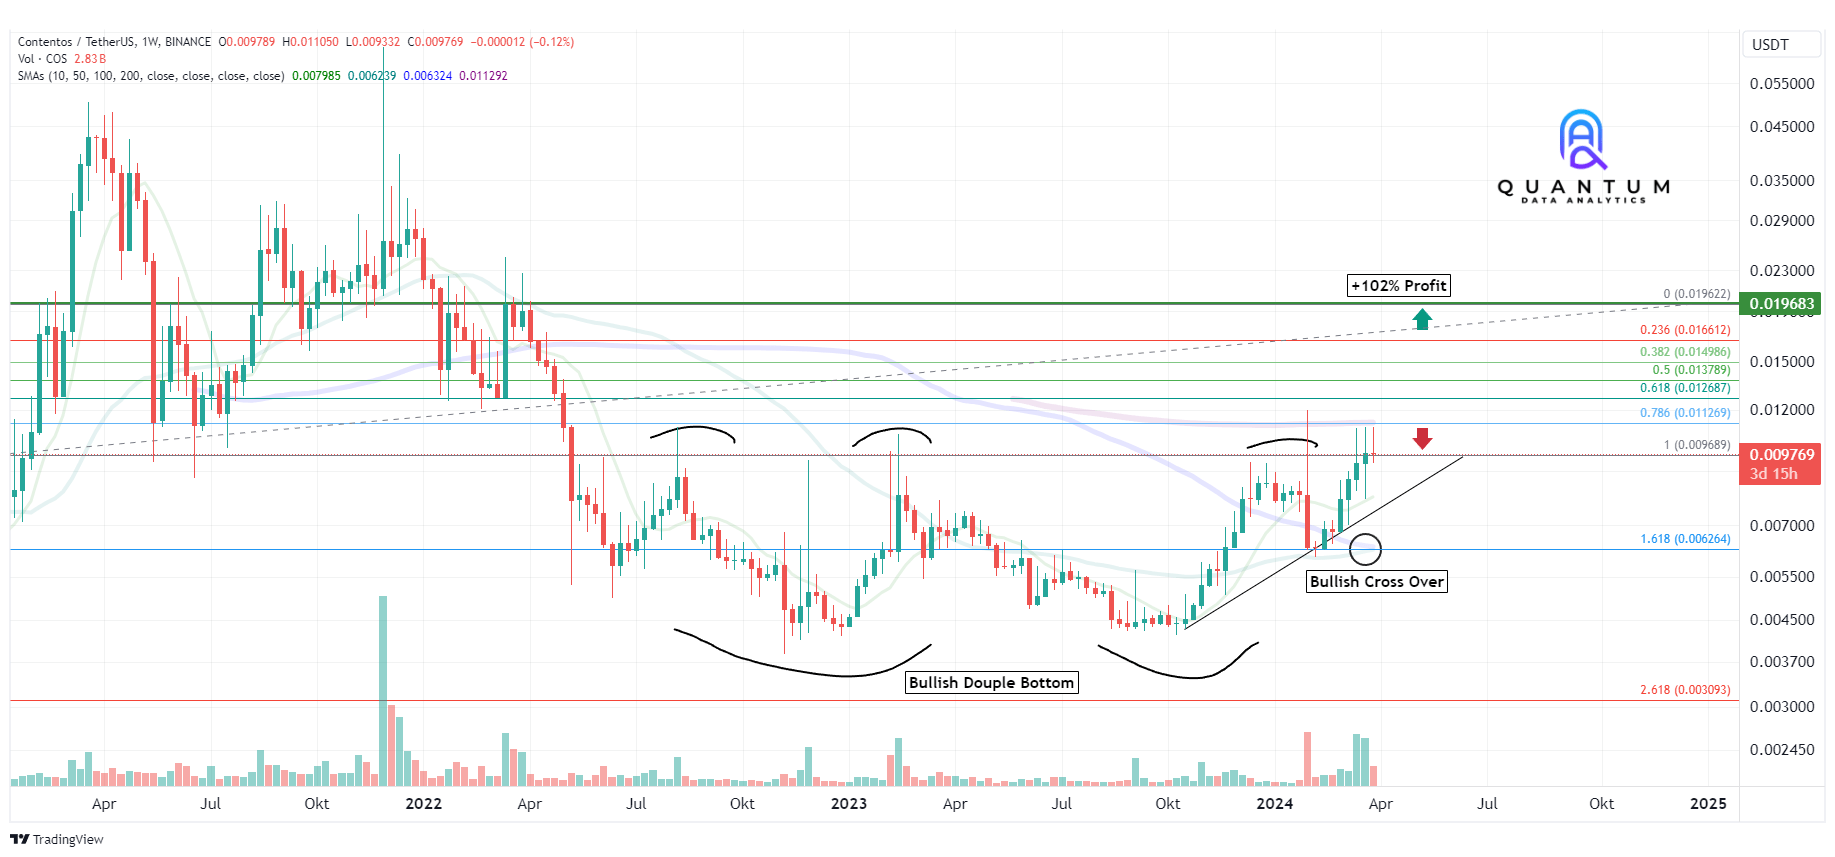
Instead of traditional candlestick charts, we use point or scatter diagrams, which represent the respective closing price. The advantages of this form of representation are particularly evident in the so-called price clusters. These clusters are areas that show a high volume of trading over an extended period. In technical chart analysis, these price clusters form particularly relevant entry and exit points for trading decisions.
Technical Analysis with AI-supported Indicator Logic
Our technical analysis combines classic market indicators with advanced methods of machine learning. A central role is played by the moving average, which not only serves as a guide but is also continuously optimized by artificial intelligence.
As a basis, we first use the classic 200-day average, which has been considered a benchmark for long-term trends in market analysis for decades. This is supplemented by a specially developed AI-based average that has been trained by analyzing historical price patterns. Both lines can indicate relevant support and resistance zones and point to possible bull or bear cycles.
A special focus is on the intersection points of these two lines, as they can signal a potential medium-term trend reversal. Such signals are algorithmically captured and weighted by us and can be used as a building block in strategic decision-making.
By combining traditional chart techniques with AI-supported pattern recognition, a multidimensional analysis level is created – for a precise assessment of complex market situations.
Note: The analysis is for the technical evaluation of markets only. It does not constitute investment advice and does not contain a trading recommendation in the legal sense.
Time Series
The models give us an insight into possible developments in the future!
AHEAD OF THE TIMES!

The application of time series models forms a central part of our analysis methodology. They serve to narrow down the probable range of future price movements and to represent them within a statistically defined trend channel.
Precise Market Analysis through Machine Learning
Using machine learning methods, we create dynamic moving averages that, in addition to a mean value, also represent upper and lower fluctuation limits.
In doing so, macroeconomic influencing factors—such as monetary policy decisions of central banks—are included, as are seasonal average values, to identify time-related patterns in price development.
By combining these data sources and analysis models, we create the basis for a well-founded assessment of potential price developments—without making fixed forecasts or guarantees.
Our Time Series Analysis – profound and up-to-date at the same time
Our time series analysis models are created daily and updated at regular intervals. In doing so, we consider the entire available historical course of an asset since its first listing to get the most precise and complete picture of the price development possible.
For better clarity, we deliberately focus on the last two years of price development in the presentation. This keeps current trends and patterns in focus—especially those that are relevant for short- to medium-term investment decisions.
Recognize market behavior – Understand patterns – Trade intelligently
We place particular emphasis on identifying conspicuous features in price development and integrating them into our analyses. These include, among other things, significant price spikes, sudden increases in volatility, and other anomalous price movements. To the extent that the data allows, these observations flow directly into our models to create the most realistic, data-based representation of market behavior possible.
A central component of our analysis is the seasonality evaluation. It allows us to recognize recurring patterns over time—on a weekly, monthly, and annual basis. In doing so, we consider the complete historical price development of the respective asset to statistically reliably capture recurring trends.
This approach provides valuable insights into typical market developments at specific times—and forms the basis for well-founded forecasts and strategic trading decisions.


