The Quantum Data Trading Strategy!
Introduction
Long-term success in digital asset trading is based on sustainable strategies and their effective implementation. Our strategy is not aimed at short-term profits with high risk, but at achieving lasting, realizable returns. That is why we rely on full automation in trading.
Our intelligent trading robots are programmed to detect strong market sell-offs at an early stage. In such situations, they act proactively by closing all open positions safely and efficiently. They then keep an eye on the market and wait patiently for the optimal time to re-enter until the selling pressure has calmed down.
This strategy ensures that our trading robots are always in the best possible position for sustainable profits – around the clock, as long as the trading robots are active. With this sophisticated approach, we bring the stability and long-term success to your digital asset portfolio that you desire.
According to the market conditions, we adjust the configuration of our trading robots, which are capable of navigating both upward and downward trends. If we are in a bull market phase, we optimize the strategy to maximize profit taking and set the stop loss orders wider to give the uptrend enough room to run. In contrast, during a bear market phase, profit targets are made more conservative and stop-loss orders are set tighter to minimize potential losses. With a variety of trading robots in our portfolio, we are able to react efficiently to all possible market conditions.

Essential for the success of our services is undoubtedly our deep and comprehensive knowledge! We can look back on a wealth of experience gained in a variety of different market situations. This gives us a sound understanding of what is feasible and realistic in the markets. We are familiar with dynamic market phases, from massive breakouts during a rally to the dreaded crashes.
Our experience has taught us that it is crucial to follow a transparent and well thought-out strategy. The focus is always on a balanced risk-reward ratio. This principle allows us to take advantage of attractive return opportunities while taking appropriate measures to limit and manage risk. Our strategy is based not only on our extensive experience and knowledge, but also on our ability to continuously monitor and analyze the markets in order to respond quickly and effectively to changes.
Our focus is primarily on macroeconomic indicators, in particular central bank monetary policy. Here, we perform correlation analysis of various factors, including money supply, inflation rates and financing conditions.
Another vital aspect of our assessments involves social media sentiment analysis. By employing specially developed filters rooted in machine learning, we construct a comprehensive image of the prevailing mood. This approach enables us to identify public sentiment and emerging trends early, which we then incorporate into our analyses.
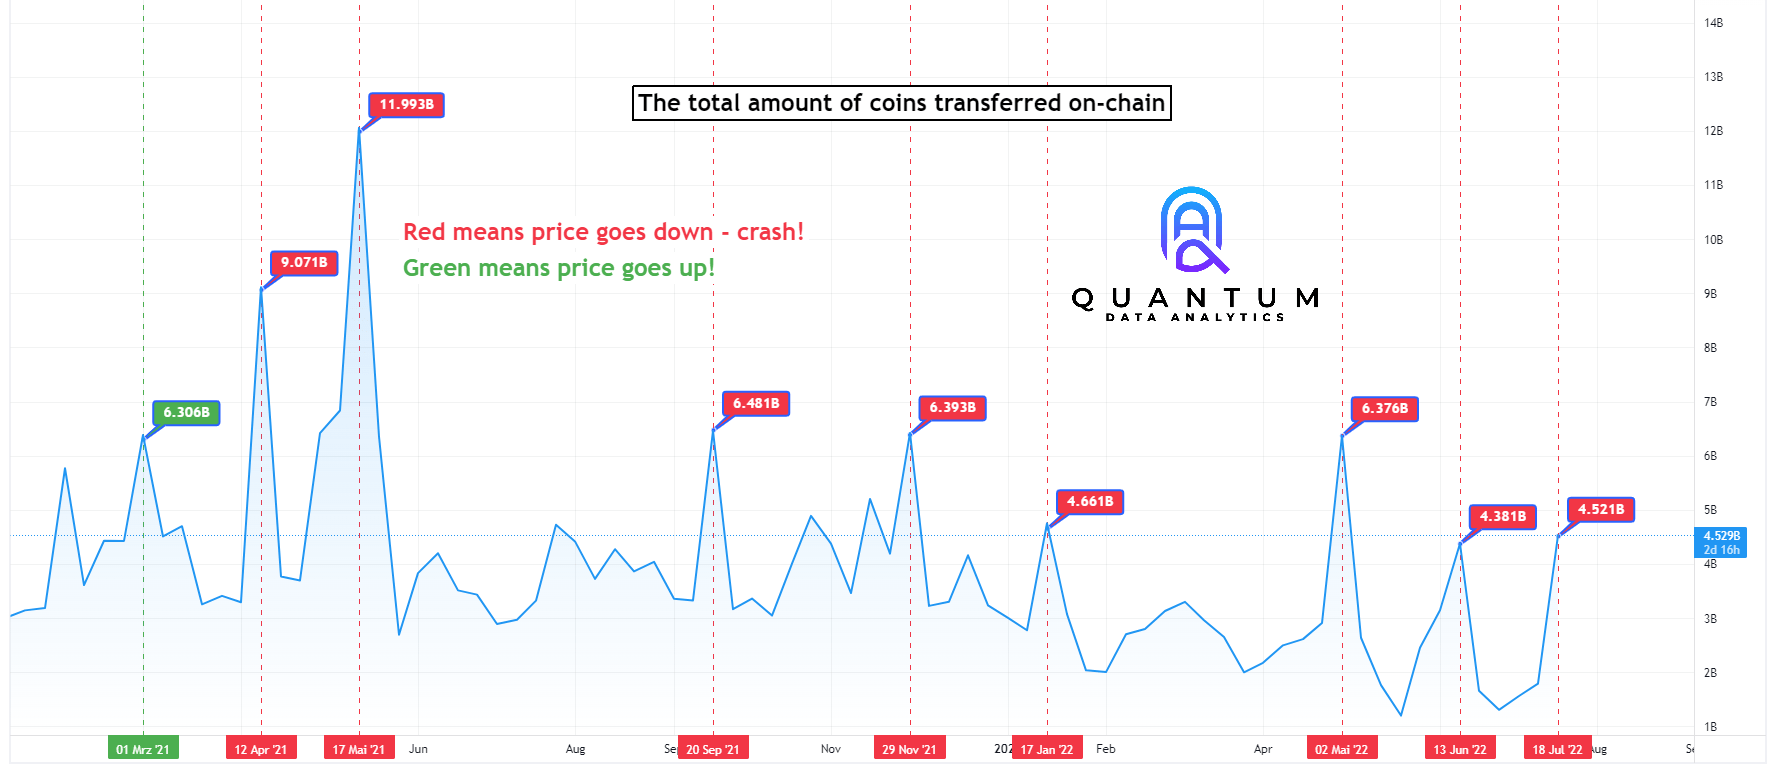
To validate and enhance our findings, we leverage additional analyses that incorporate crucial factors such as on-chain data and quantitative analysis. Through the integration of these varied data sources, we aim to provide a thorough and accurate market assessment that informs our trading strategies.
The regression technique allows us to conduct an in-depth, three-dimensional analysis of the asset, yielding significant indicators applicable in various market conditions. Moving averages offer robust reference points for entering and exiting trades, continuously refined and optimized via machine learning methods.
The quality of the asset is fundamental to our approach. Our focus is on assets that not only have a large community, but above all offer solutions to existing challenges through their technology. Phenomena such as “Meme Coins” or “NFTs” (Non-Fungible Tokens) do not fit our trading profile and are therefore not included in our trading. So that you are always up to date, visit us on Facebook or Twitter.
Our Assets:
Market Research

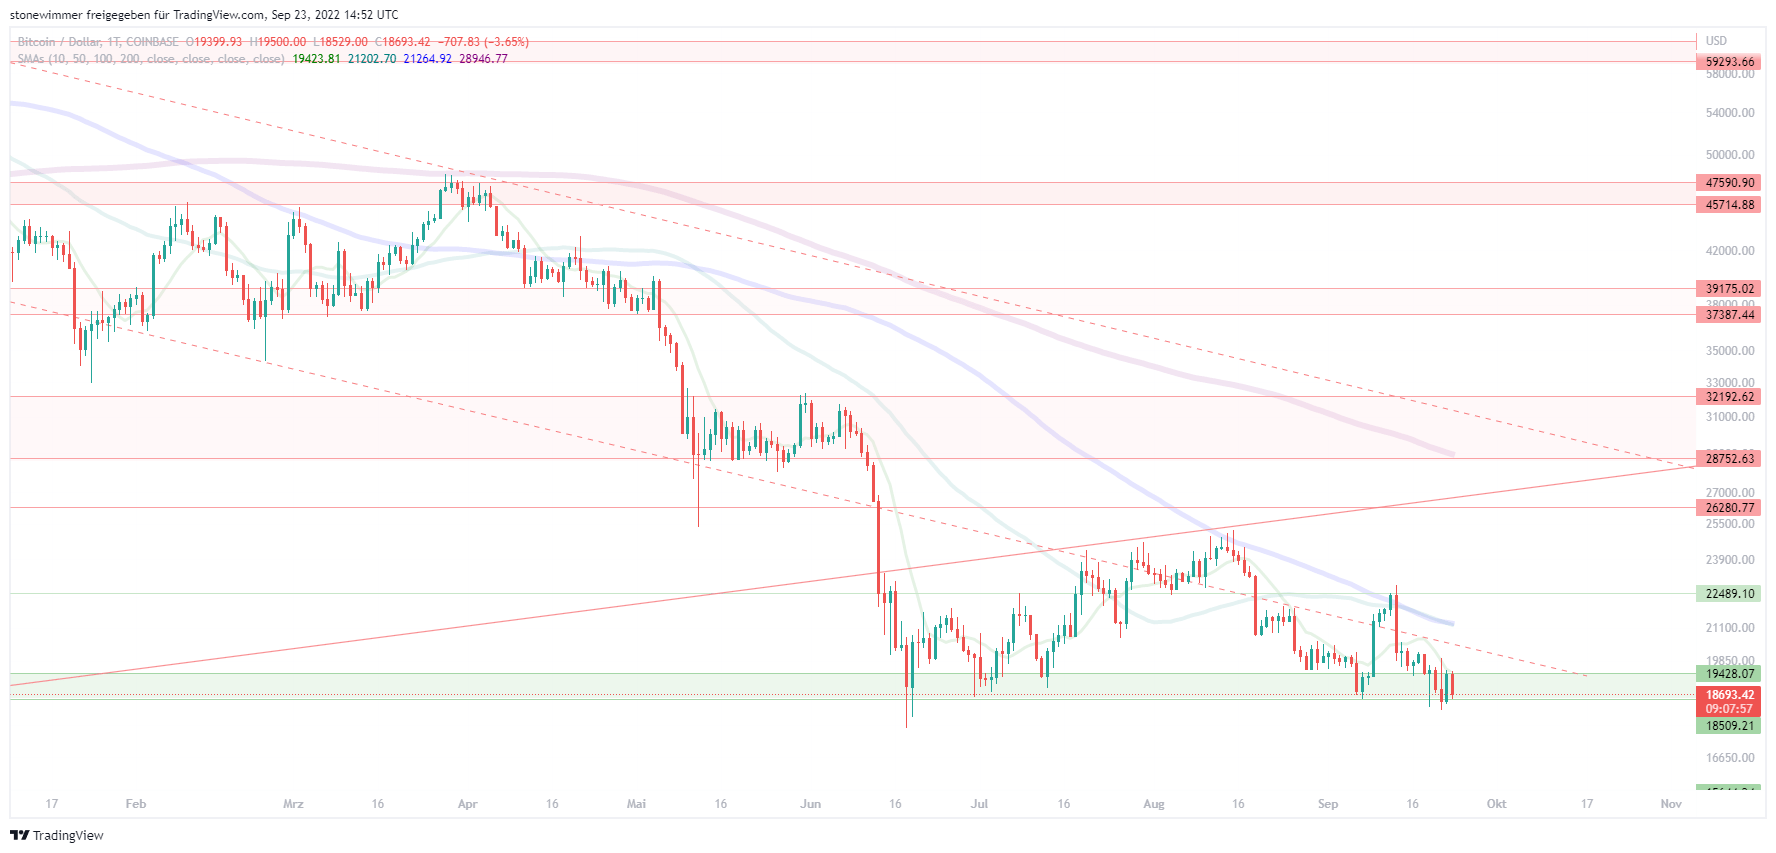
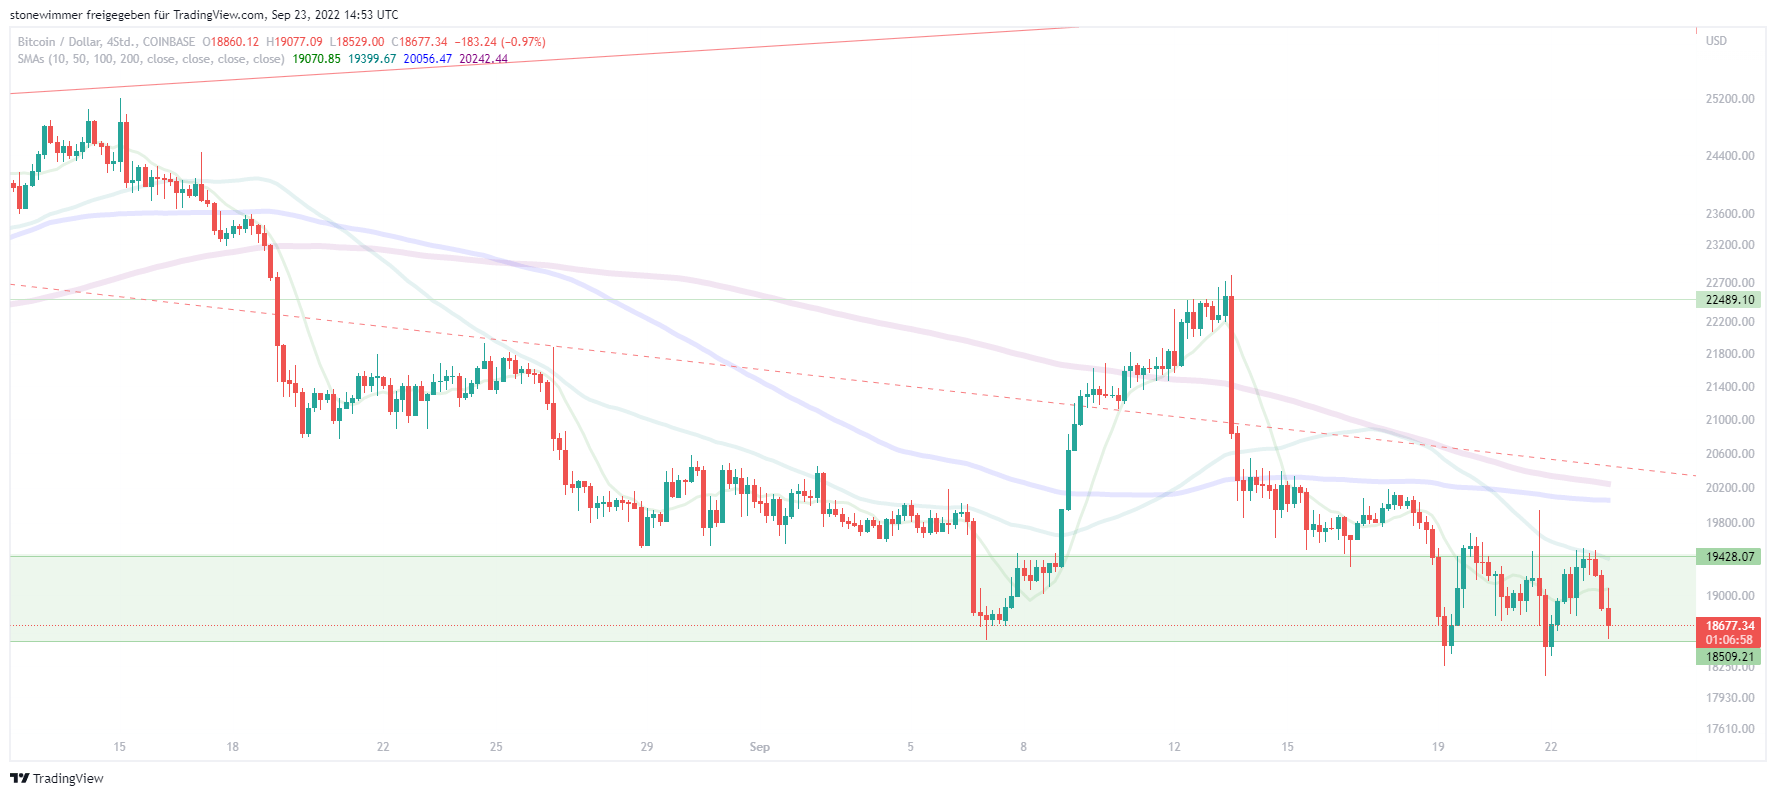
Our market analyses are thorough, leveraging robust industry-specific tools and exclusive fundamental analytical methodologies. They span a broad spectrum of areas. Beyond employing traditional charting techniques, we also delve into regressive deep analysis. By harnessing the power of machine learning, we generate accurate price forecasts and identify seasonal market fluctuations through the use of time series models.
In our market analysis we try to give an overall impression.
To ensure transparency and traceability of our exclusive trading strategies, we publish them at regular intervals and archive them in their original format. Our exhaustive analyses, both for the Market Cap and specifically for Bitcoin, are accessible to the public without restriction. Comprehensive analyses on other subjects and markets are exclusively available to our registered members and clients.
We continuously and systematically refine the structure and content of our fundamental analyses. In doing so, we regularly incorporate innovative techniques and methods. Our aim is to depict the multi-layered complexity of the market in a comprehensive yet understandable way. We achieve this by continually broadening our perspectives and constantly adapting our analytical approach to the dynamic market conditions.
Market analysis includes various aspects such as technical indicators, regression-based moving averages and data indicating the liquidity of an asset, such as open interest. When collecting data, we not only draw on information that comes directly from the assets themselves, but also consider external sources. Our analyses also include data from well-known analysis centres such as CryptoQuant and Glassnode.
Examples
Technical Indicators!
Technical indicators show the current mood, which are of decisive importance in trading!
For our technical indicators, we rely on regression-based models and comprehensive statistical analyses. Through these methods, we generate a three-dimensional logarithmic price curve that maps predictable market dynamics within a predefined valuation period. This approach enables us to glean detailed insights into the market conditions of a given trading cycle. To augment and support our data visualizations, we use moving averages. These are employed to smooth out short-term fluctuations and highlight longer-term trends or cycles.

Our regression models leverage color significantly, as they symbolize market moods. Here, color intensity correlates with trend confirmation: the stronger the color, the more pronounced the trend. Moreover, these colors can denote potential trend reversal points, frequently serving as valuable indicators for buying or selling opportunities. Our trading robots successfully employ this method.
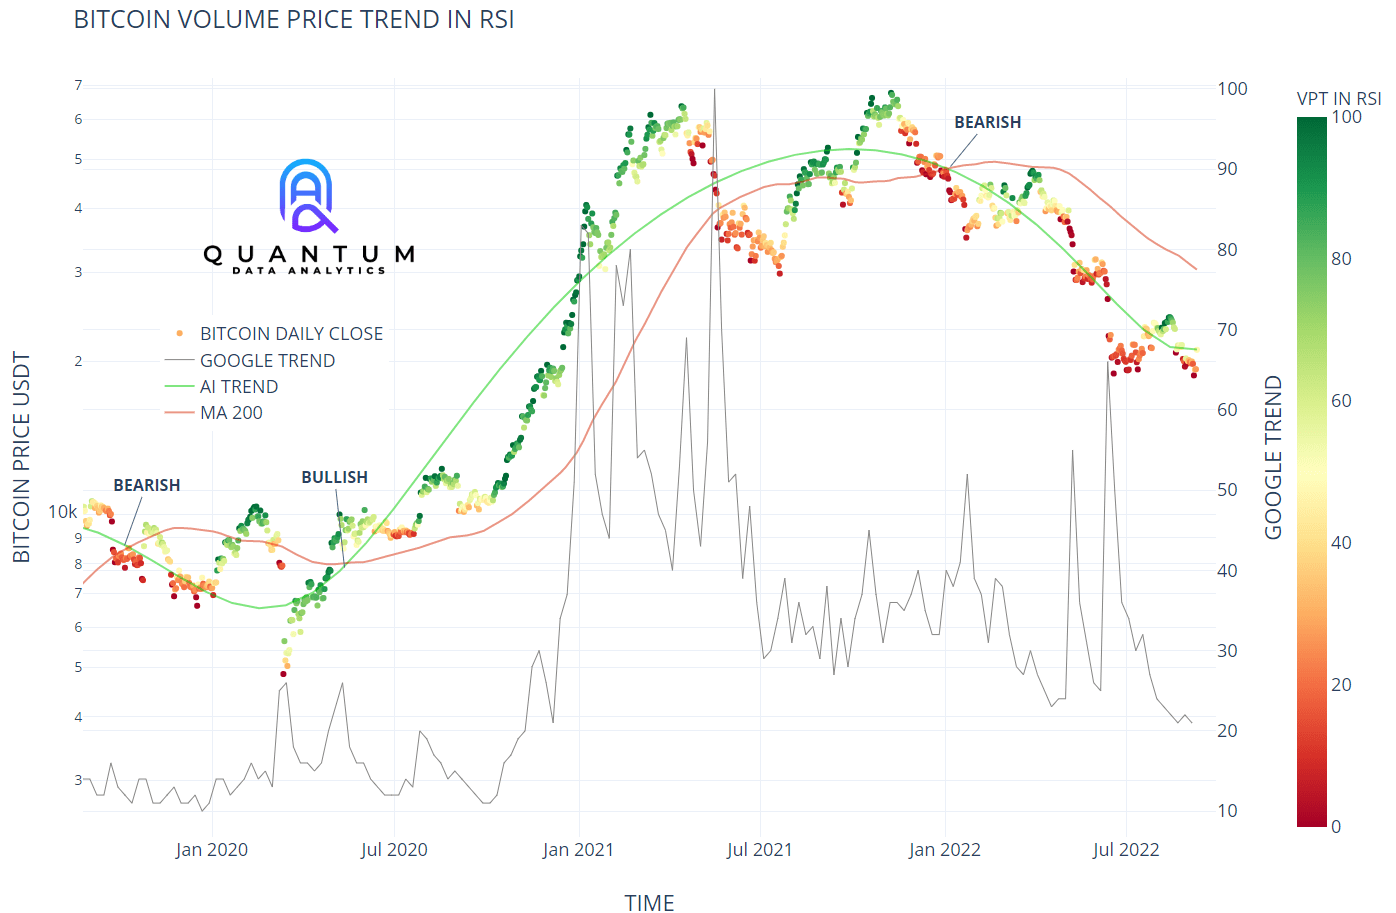
Rather than using traditional candlestick charts, we utilize dot or scatter charts to represent the respective closing prices. The advantages of this form of representation become particularly evident in the so-called price clusters. These clusters, areas of high trading volume over extended periods, often form critical entry and exit points for trading decisions in technical chart analysis.
Our technical analysis includes the use of moving averages, generated through the application of machine learning. In this context, artificial intelligence becomes a critical component, primarily in the identification of recurring patterns.
We begin our analyses by utilizing the traditional 200-day average as a fundamental indicator. This is augmented by our proprietary moving average, which leverages AI-based algorithms. Both these lines exhibit distinctive characteristics – they not only signify significant price support and resistance points, but also serve as markers for bull and bear cycles.
Another crucial aspect is that the intersection of these two lines may indicate a potential medium-term trend reversal. This serves as a key signal for impending market changes and can underpin strategic decisions. Integrating traditional and AI-based indicators in our analysis allows for a thorough and precise market evaluation, laying the foundation for optimal trading decisions.
Examples
Time Units!

The utilization of time series models forms a pivotal aspect of our analytical methodology. These models enable us to pinpoint the probable range of future price trends and encapsulate them within a trend channel. By harnessing machine learning techniques, we generate moving averages that portray a mean, along with upper and lower boundaries.
In computing these averages, we consider dominant influencing factors, such as current monetary policy actions enacted by central banks. In addition, we incorporate seasonal averages into our models to compensate for any seasonal impacts on price trajectories. Through the amalgamation of these diverse methods and datasets, we strive to furnish a detailed and comprehensive forecast of price trends.
The models give us an insight into possible developments in the future!
Our time series analysis models are constructed daily and regularly updated. These models consider the entire available history of an asset, starting from its initial stock market recording, to ensure a comprehensive and precise depiction of the asset’s price evolution.
Nevertheless, for improved clarity and ease of handling, we consistently visualize the price development of the past two years. This approach allows us to keep our focus on relevant, current trends and patterns, which are particularly essential for short to medium-term investment decisions.
Additionally, we place significant emphasis on identifying and accounting for peculiarities in price evolution. Such peculiarities could include substantial price spikes, uncommon volatility, or other aberrant price movements. To the extent that the data permits, these features are incorporated into our models, aiming to create a price evolution model that is as realistic and significant as possible.
The seasonality analysis we employ in our research helps us to gain a profound understanding of how the market typically behaves at specific points in time. Our time horizon encompasses weekly, monthly, and annual cycles. In considering seasonality, we take into account the entire historical timeline of the relevant asset. This offers valuable insights into recurring patterns and trends, aiding us in making well-informed forecasts and decisions.
Examples
QUANTUM DATA TRADING
“You win, we win – Our success is based on your commission! And that is 10% of your net profit!”

Worldwide Trading!
Currently we offer Binance, but soon we will add other trading venues like Coinbase.
Unlimited Signals
All buy and sell signals are included in the package. There are no extra or additional costs!
24 Hours, 365 Days!
We trade around the clock, holidays and weekends, 365 days a year.


