




















IN FOCUS
OF TIME
Time series analyses are the systematic examination of time-ordered data in order to identify patterns, trends and seasonal effects and to predict future developments.

TIMESERIES!
Time series analyses enable the development and application of quantitative models that support precise predictions and automated trading strategies.
Ahead of the times!
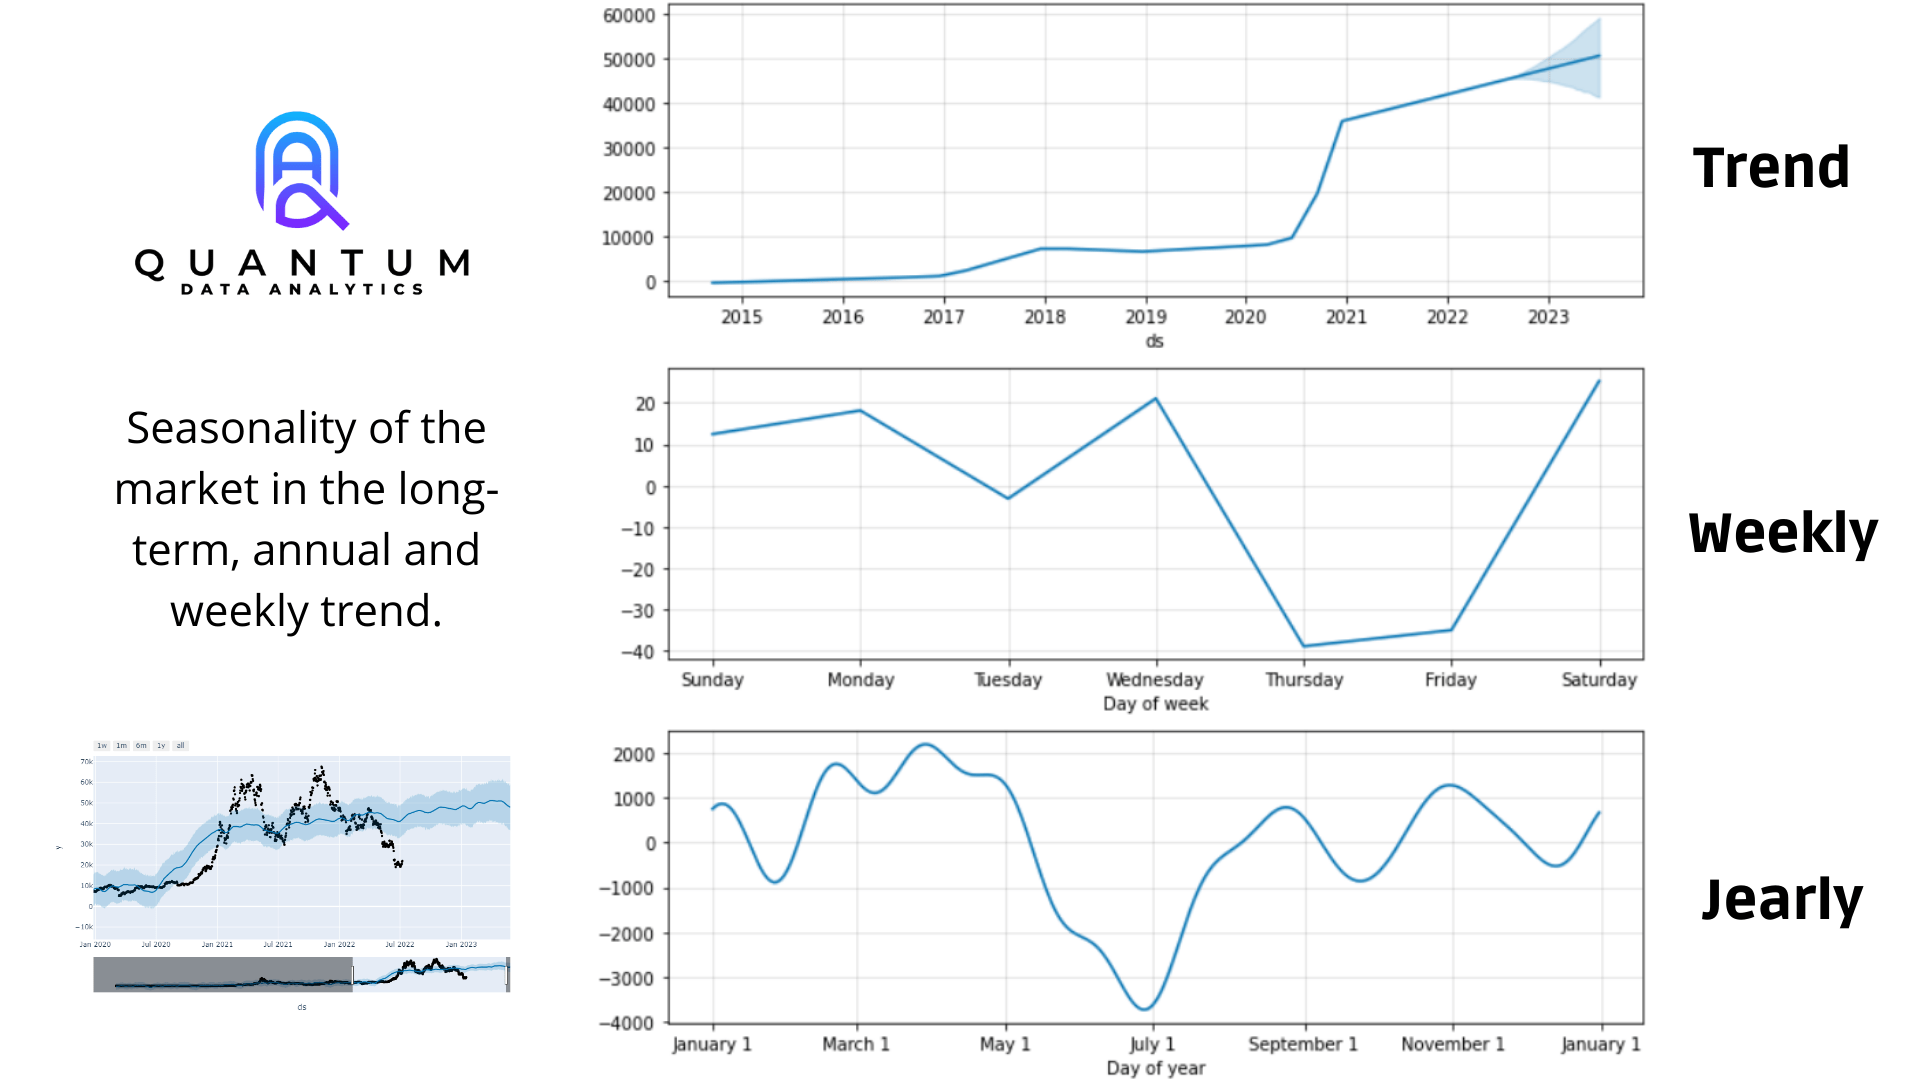
Cyclical seasonalities are important in order to obtain a uniform picture of current developments on the market for digital assets.
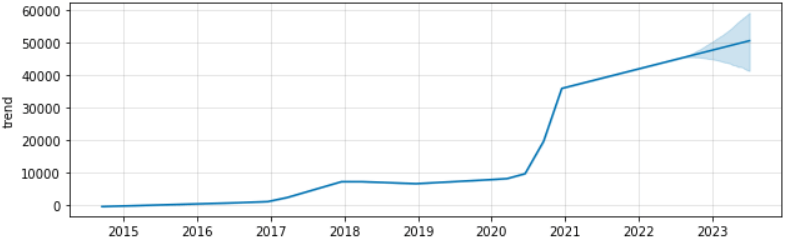
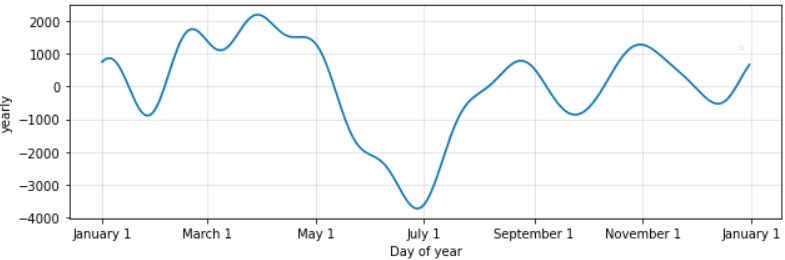
We analyse the seasonalities and divide them into the general trend, the weekly rhythm and the course of the year. This information is based on quantitative averages that summarise the most likely developments. Deviations can occur depending on the market environment and can also be viewed in reverse. Nevertheless, they provide valuable indications of how the average development in a technical environment may develop.

We analyse seasonality based on quantitative averages to provide valuable indications of the most likely developments in the technical environment.
2
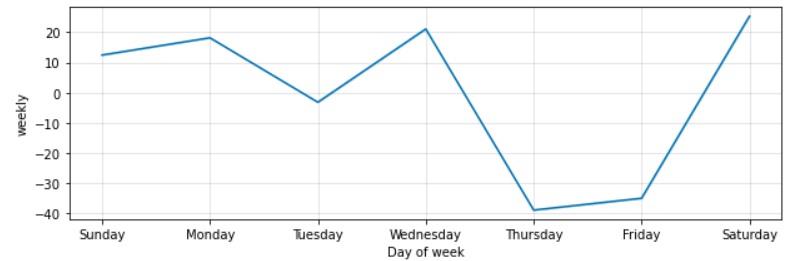
Weekly
The weekly cycle illustrates the course of trading activity from Monday to Sunday and its impact on price trends. This chart can be used to identify both bullish and bearish trading days, which are characterised by rising or falling prices on average. The possibility of developing targeted trading strategies and better understanding market events by analysing this cycle is particularly noteworthy. This detailed analysis makes it possible to make well-founded decisions and thus to act successfully in the long term.
[rev_slider alias="futuresight-digital-marketing-1"][/rev_slider]