


Current trading strategy of the trading robots in the mid-cycle.
11. September 2024
The Quantum Signal Robot MORAI
21. August 2025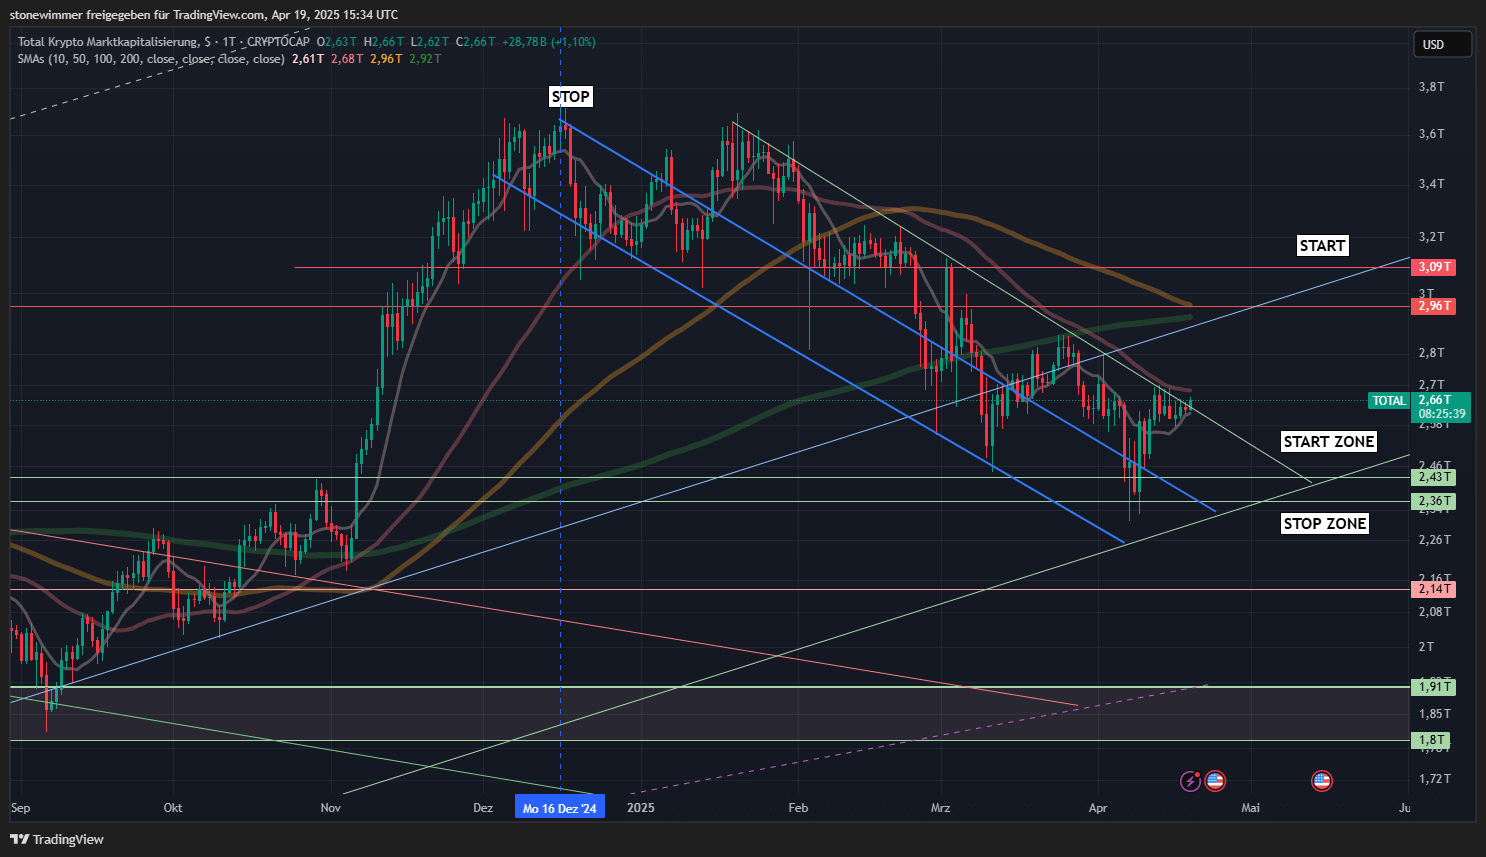
Chart Analysis Including Macroeconomic Influences
The weekly chart of the total market capitalization (TOTAL) of digital assets initially suggests a bullish structural picture. Since the cyclical low at the end of 2022, we observe a stable, well-defined uptrend characterized by higher lows and consistent trend waves. The recent rise from approximately $1.4 trillion to $2.7 trillion over the past 15 months further supports this underlying demand.
However, despite the apparent technical strength, caution is warranted. The broader macroeconomic context surrounding this uptrend is far from clearly bullish—in fact, it reflects a fragile equilibrium between optimism and unresolved risk factors. Notably, the price movement has recently stalled just below a key resistance zone between $2.96 and $3.09 trillion. This area marked the peak of the last major bull cycle in November 2021 and is now once again being heavily defended. A clean breakout has yet to materialize, indicating a certain degree of hesitation, particularly from institutional players.

One major contributor to this uncertainty is the current monetary policy stance of the U.S. Federal Reserve (Fed). Although the Fed paused its balance sheet reduction in April 2025, there has been no indication of an imminent pivot to an expansionary stance—such as interest rate cuts or quantitative easing. Additionally, it remains unclear how the Fed will respond to new inflationary pressures stemming from the U.S. trade tariff policies. The next interest rate decision is scheduled for June, and the probability of a 25-basis-point rate cut currently stands at only 54%, according to the FedWatch tool. In short, the market cannot yet rely on monetary stimulus, which in turn dampens risk appetite across the board.
This restrictive stance from the Fed is not just symbolic; it tangibly limits growth potential and investor confidence—particularly among institutions managing large capital pools.
As a result, we are witnessing a form of “capped optimism” on the charts: while prices remain above the 20- and 50-week EMAs, both momentum and volume are tapering off. This behavior is typical of a transitional market phase that is technically intact but lacks a solid macroeconomic foundation to confirm a sustained bull run.
From a structural perspective, the current price behavior resembles an ascending triangle, formed by rising lows and a horizontal resistance ceiling. This is typically a bullish pattern, but only when it resolves with dynamic upward momentum. So far, however, such a breakout has been elusive. Neither the Fed, nor geopolitical stability, nor sector rotation has delivered the necessary catalyst to push the market convincingly higher.
Strategic Deployment Plan for Indicator-Based Trading Bots Morai 1.5
In light of the chart and macro analysis above, the deployment strategy for algorithmic trading systems should follow a clearly tiered approach—one that integrates both technical confirmation and macroeconomic alignment.
1. Preparation Phase (current phase, since Dec 14, 2024):
Since exiting all positions in December 2024, our systems have remained inactive. This is a deliberate strategy: no trade is often the best trade in uncertain phases. During this period, bots operate in analytical mode only. They continuously monitor real-time chart data, volume flows, moving averages, market breadth (e.g., TOTAL3 excluding BTC & ETH), and macroeconomic indicators. Automated alerts are active but do not trigger trades—they simply identify breakout zones and anomalies for review.
2. Activation Conditions – Technical Structure:
Bots will re-engage only if a weekly close breaks above the $3.09 trillion resistance zone, supported by increasing volume, RSI above 65, and a bullish MACD crossover. A brief move above this level is insufficient; sustained confirmation is required. Alternatively, a retracement toward the $2.43 trillion support zone could serve as a re-entry point—but only if a bullish reversal signal forms (e.g., Morning Star or hammer candlestick pattern).
3. Gradual Position Building:
Upon activation, positions are opened gradually. Initial entry uses approx. 30% of allocated capital, protected by stop-loss levels defined by key support zones. If the position yields a gain of 5% or more while the macro environment remains stable (i.e., no interest rate shocks or geopolitical escalations), a second position may be initiated in a correlated asset (e.g., ETH vs BTC, SOL vs AVAX).
4. Exit Strategy on Macro Escalation:
If macro conditions deteriorate—such as a hawkish Fed pivot, rising tariffs, or geopolitical escalation—bots halt all new entries. Existing positions are either moved to breakeven or monitored with trailing stops. If predefined take-profit targets are reached (as outlined in the client dashboard), full exits are executed, and systems return to observation mode.
5. Re-Evaluation After Each Fed Decision or Geopolitical Event:
After each major macroeconomic decision, especially FOMC announcements, all algorithms are recalibrated. If the Fed maintains a restrictive stance or trade wars intensify, bots will not reactivate—even if technical signals are triggered. In such cases, alerts are issued but must be manually reviewed and confirmed.
Conclusion
The market currently displays a structurally bullish chart, yet lacks sufficient macroeconomic confirmation to initiate an aggressive entry. The potential for a short-term rally exists but remains capped by external uncertainty—especially the Fed’s monetary policy and U.S. trade actions. Our trading bots, such as Morai 1.5, are therefore fully primed but restrained. Only when technical breakouts and macroeconomic signals align will a new trade cycle be launched. Until then, we remain observant, measured, and ready to act with precision.


