


Our Analysis Technology at a Glance
We use advanced technologies for our market analyses to generate precise insights and make reliable forecasts.
Research & tools only — no investment advice.
No order execution, no custody of client funds.
All decisions are made exclusively by the respective account holder.
Our Methodology
To gain a comprehensive view of the markets, we work with regression models, time series analyses, seasonal patterns, and various AI models based on deep learning.
Technical Analyses
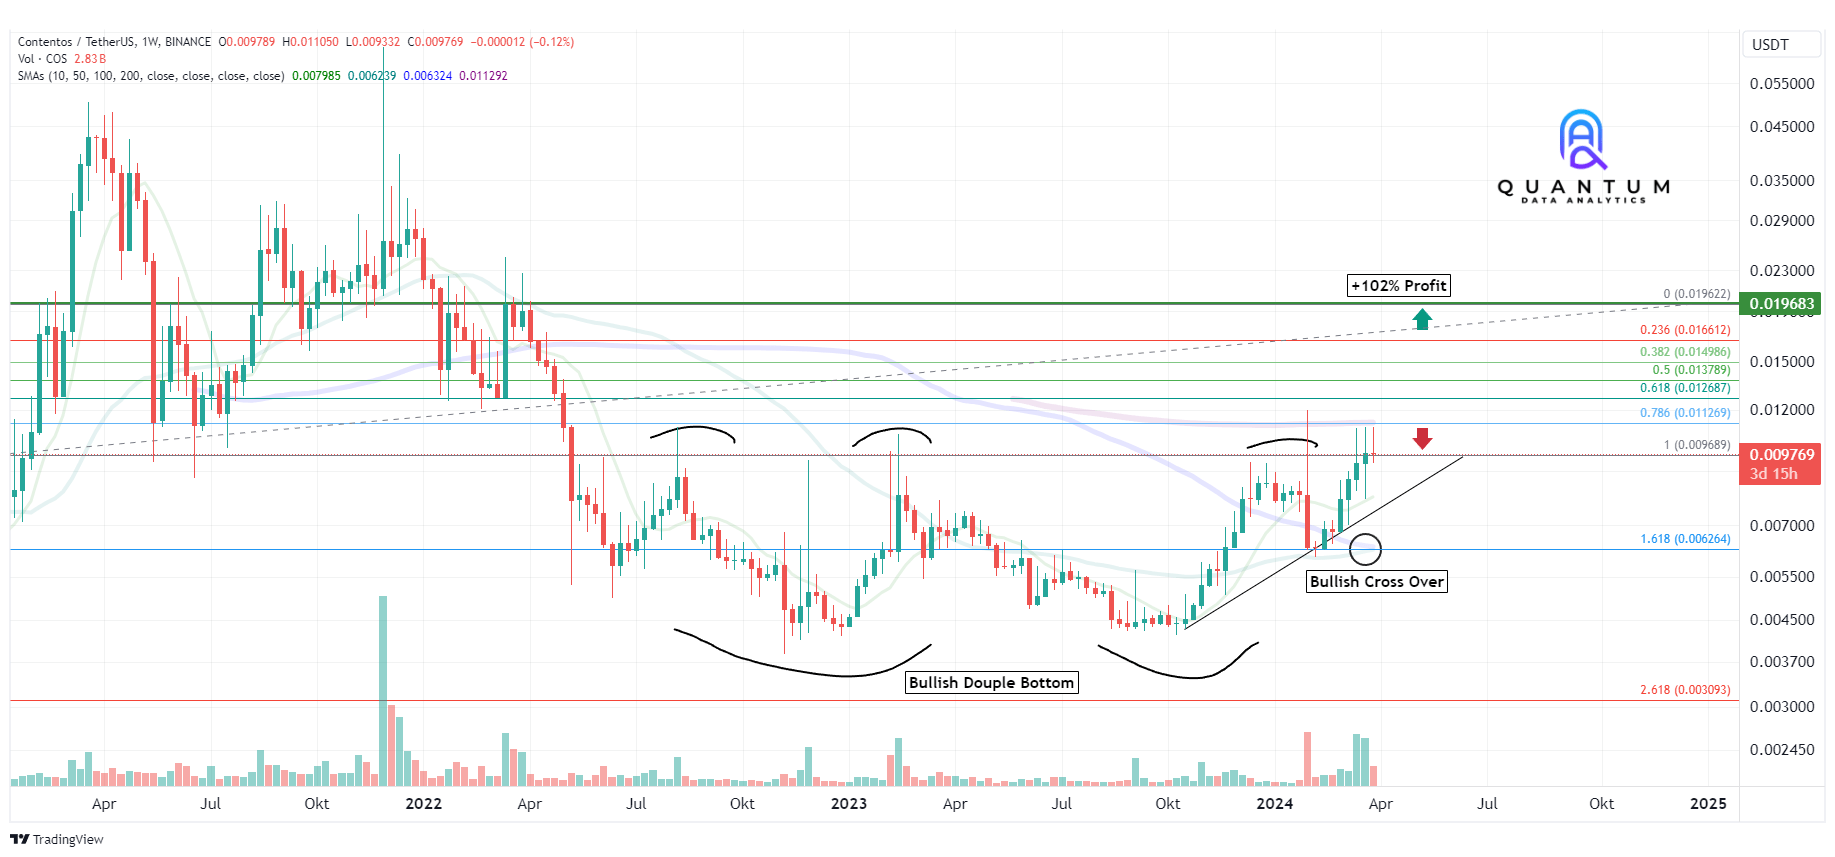
By using advanced chart analysis techniques, Quantum Data Analytics enables deeper insights into market dynamics in order to precisely identify critical turning points and trendlines.
At Quantum Data Analytics, we extend classical chart analysis through the targeted use of modern regression and time series analyses. This combination enables a significantly clearer picture of the current market situation and makes relevant structures within the chart precisely visible. In this way, we identify support and resistance zones with higher accuracy and derive meaningful price ranges. The foundation for this is a broad selection of indicators, which we determine with precision using artificial intelligence and consistently integrate into our market analyses.
“Prices are not random sequences. By studying past price movements, we can identify patterns and trends that help us anticipate future price behavior.”
– John Bollinger
Timeframes
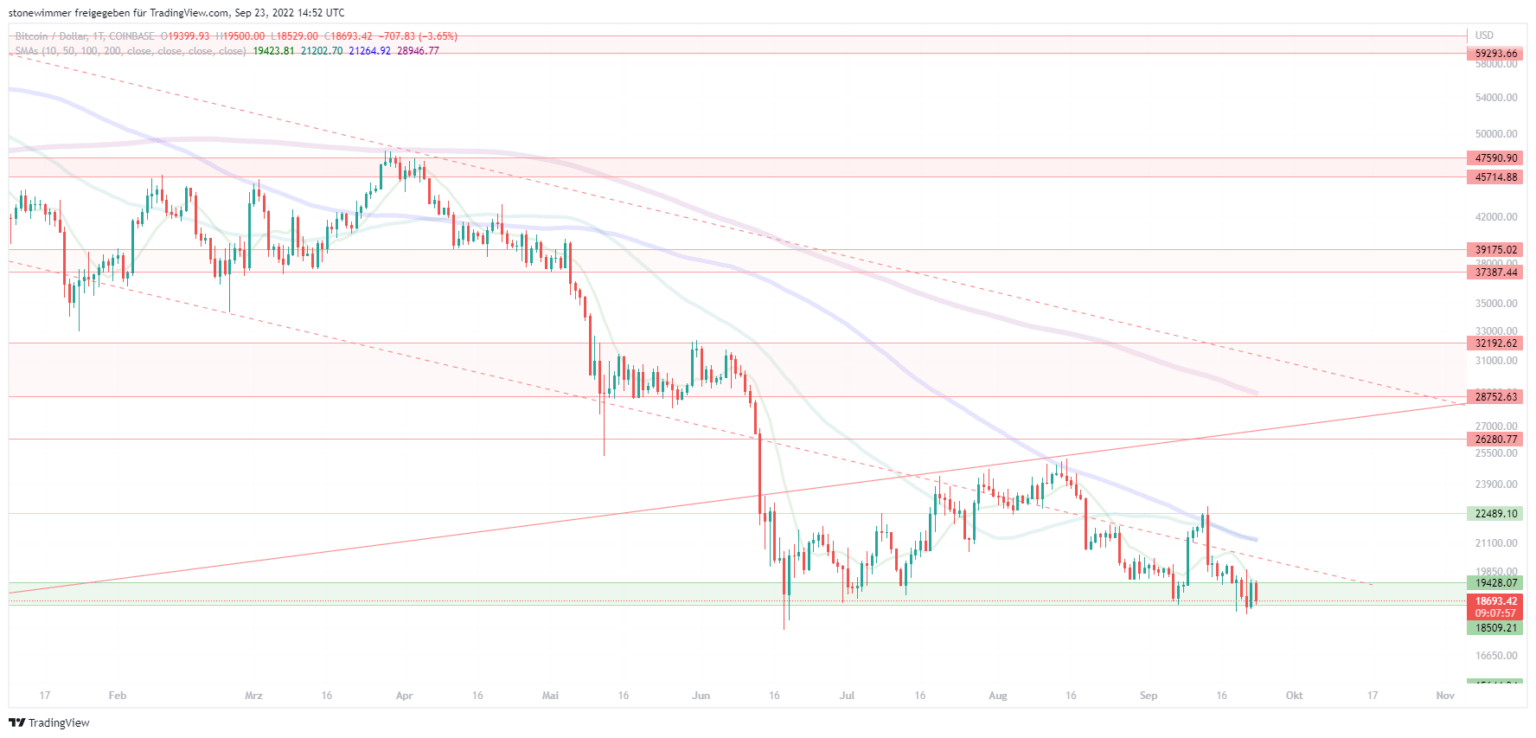
Our technical chart analyses begin with the 4-hour chart and extend up to the weekly chart. Naturally, we also take charts in smaller timeframes into account in order to obtain a coherent overall picture of the market. However, these smaller timeframes are not published, as their speed makes them less reliable. Nevertheless, all timeframes must align to enable well-founded decision-making.
Price Zones
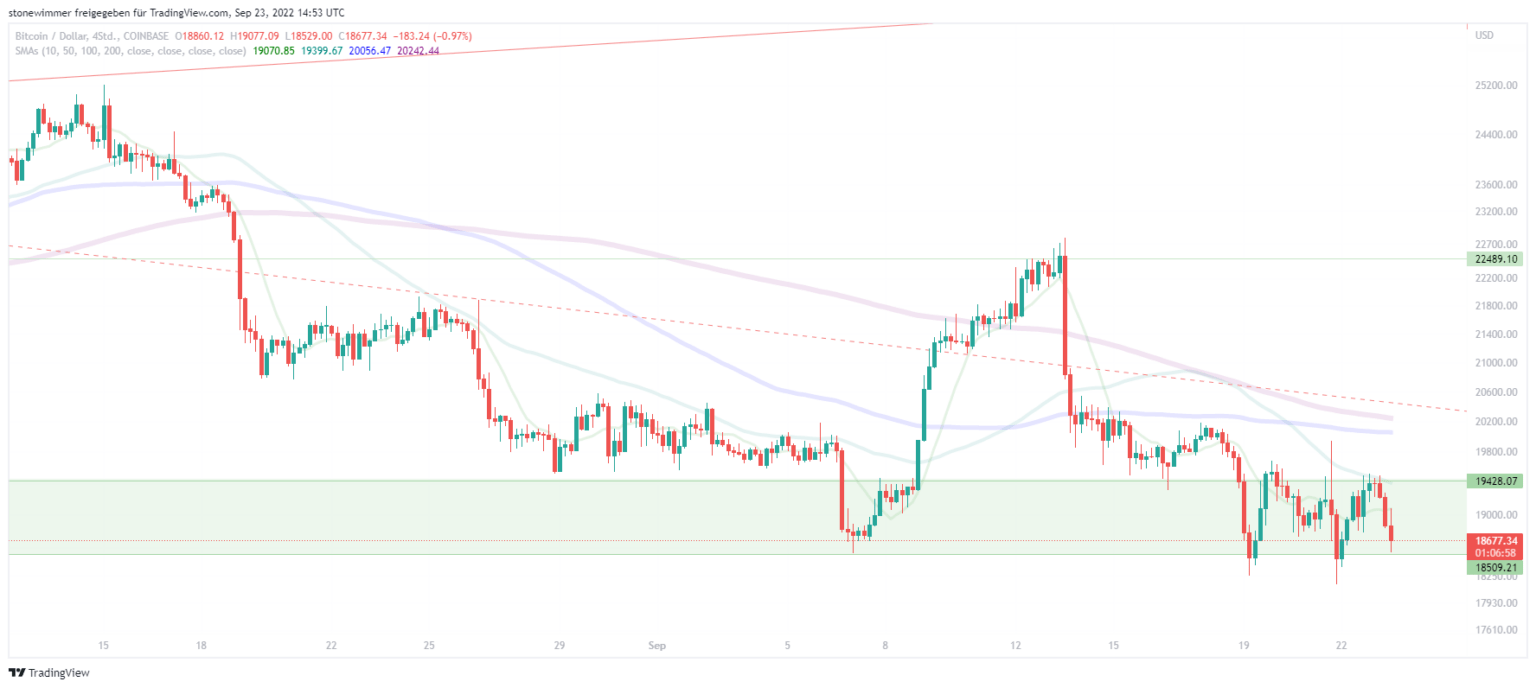
Support and resistance levels are highlighted. These price zones are of great importance, as they signal the highest trading activity. A longer stay within these zones may also indicate a possible trend reversal. By precisely identifying these zones, potential market movements can be forecast more effectively and trading strategies can be optimized. The price zones are color-coded and displayed as support zones (green) and resistance zones (red).
Fibonacci-Retracements
Fibonacci retracements are used both in our analyses and in our trading bots, as they represent a significant psychological aspect of trading. These retracements identify key support and resistance areas during price formation and can help determine potential market highs and lows. Applying Fibonacci retracements enables a more precise assessment of price corrections and trend continuations. This allows us to make well-founded trading decisions and manage risk more effectively.
Fibonacci-Retracements
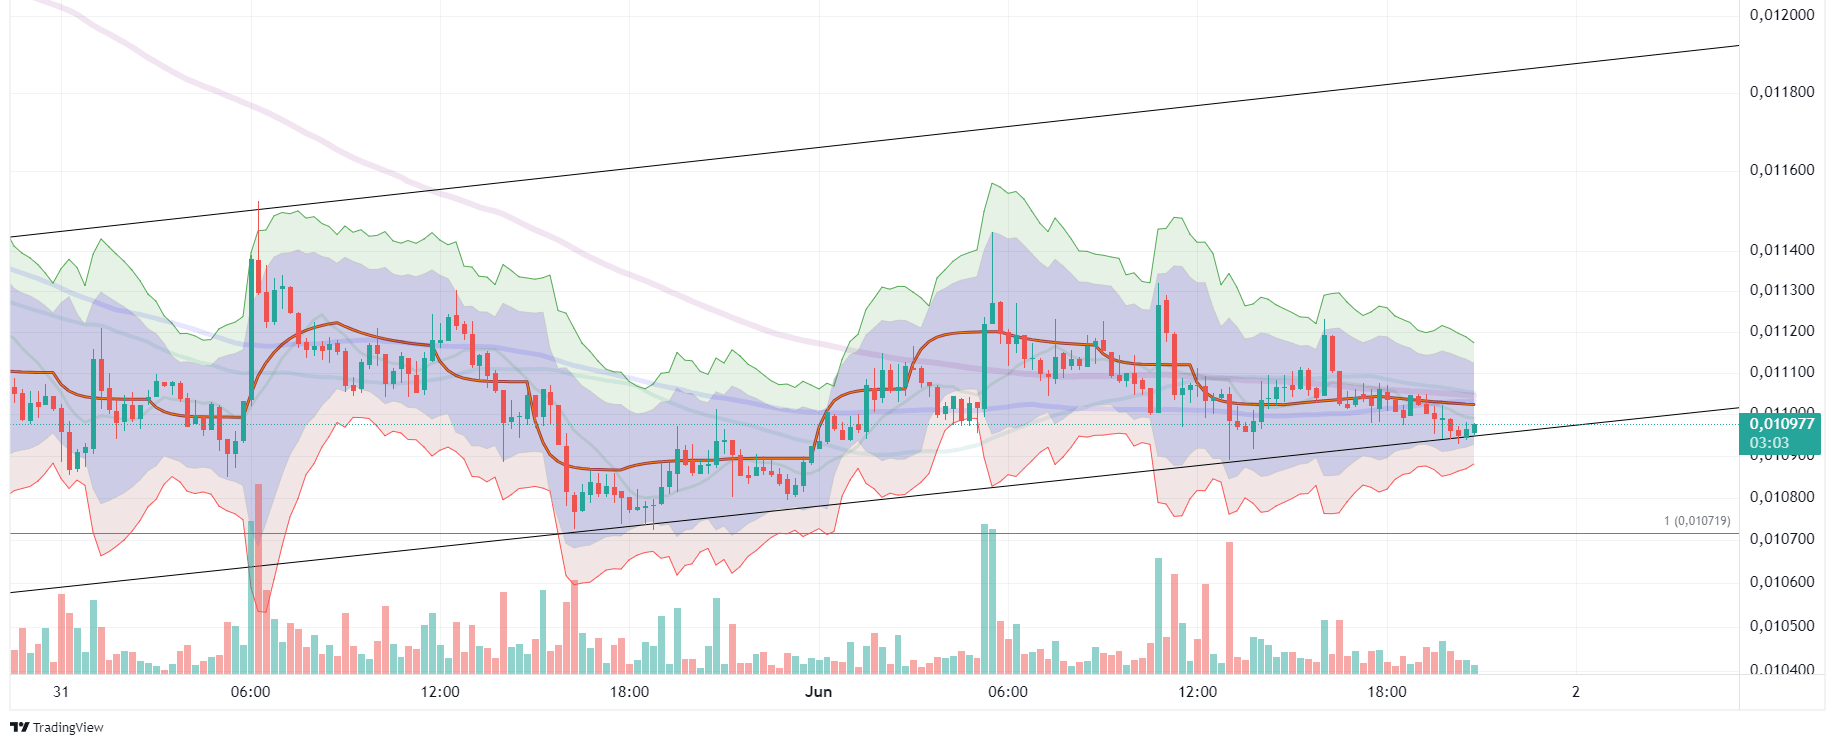
For our trading operations, we use key indicators both for our analyses and for our trading algorithms that have proven their reliability over many years and have reached an established status in financial markets. These include a wide range of momentum indicators as well as oscillators. To obtain real-time data, we have developed our own proprietary indicators that complement standard indicators used on trading venues. In addition, we use artificial intelligence to identify and adapt the most suitable indicators depending on the current market situation.
On-Chain
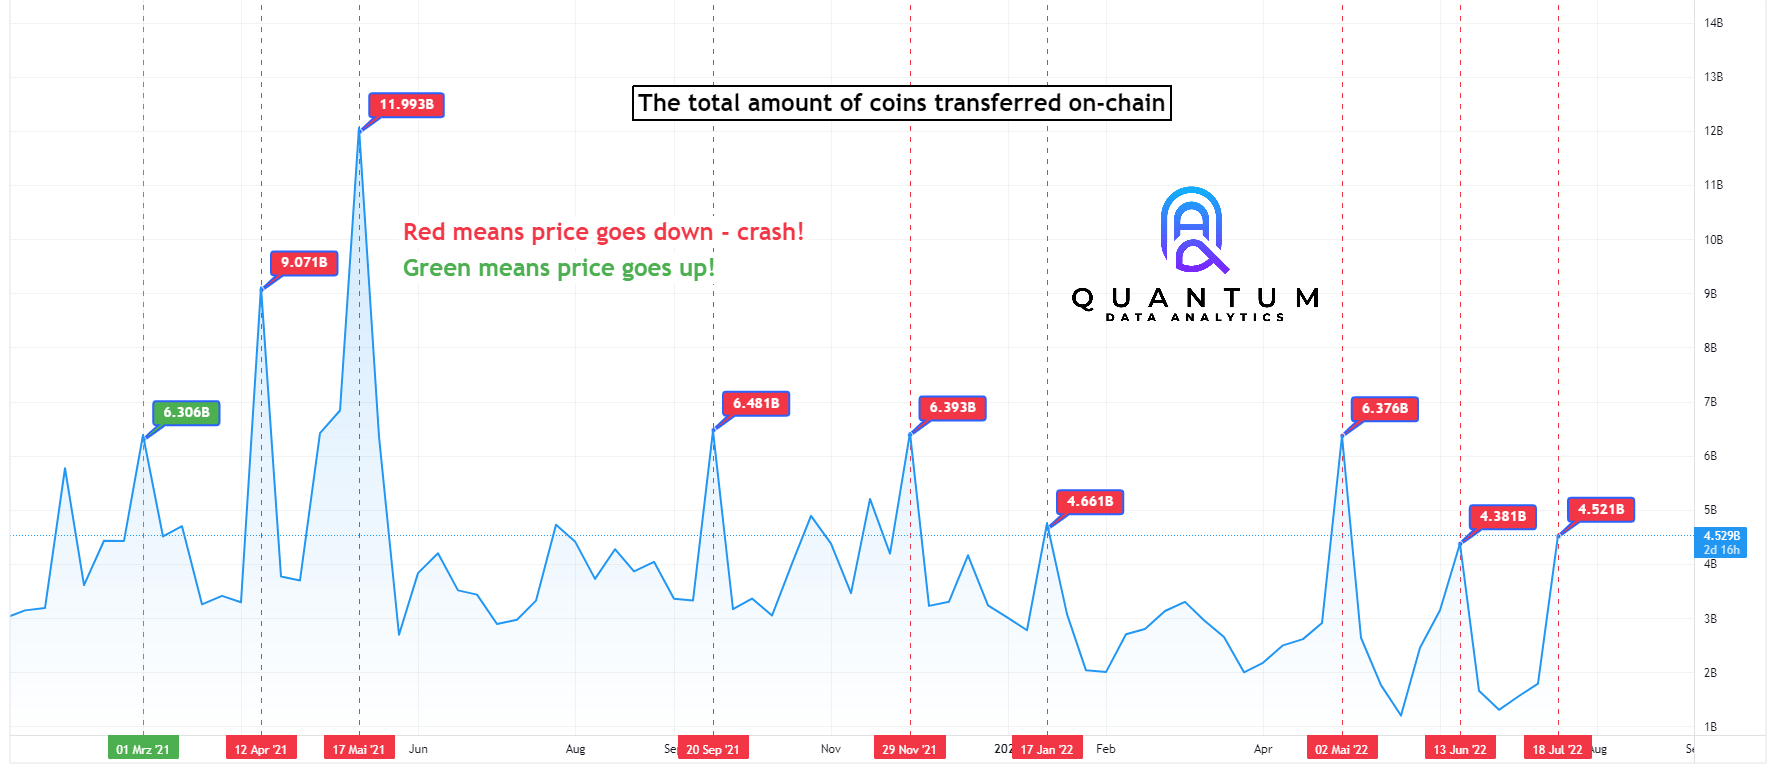
To assess different market conditions in real time, we incorporate additional on-chain data into our analyses. These on-chain data are also used in our regression analyses to gain a more comprehensive view of market dynamics. By integrating on-chain data into our analysis framework, we directly reflect supply and demand through quantitative data, providing a deeper and more accurate picture than conventional chart analysis alone.
One example is the analysis of asset transfer activity. When assets are increasingly transferred to private wallets instead of trading platforms, this indicates a growing selling interest and suggests potential upcoming selling pressure. Conversely, when assets are withdrawn from exchanges, exchange reserves decrease, which—given corresponding buy orders—can lead to increased buying pressure.
AI Analyses
What AI can do — and what it cannot

Thanks to artificial intelligence, vast amounts of data can be analyzed and patterns identified that are difficult for human analysts to access, leading to more accurate market forecasts.
AI is currently a central topic and will most likely remain so in the foreseeable future. In our work, we focus intensively on the application of AI in both data analysis and trading. As a result, we have in-depth knowledge of the potential AI offers—and of its limitations.
“AI enables continuous real-time monitoring and analysis of market data, allowing us to respond more quickly to changing market conditions.”
– Erik Wimmer
Trend Channel

Trend Strength
Through machine learning, artificial intelligence is able not only to generate trend channels but also to forecast trend strength. This is achieved by analyzing the relationship between trading volume and price developments. These trends are often seasonal and repeat in specific cycles. As a result, AI can project potential trend intensities within channels, which is helpful for identifying possible trend reversals.
Trendline
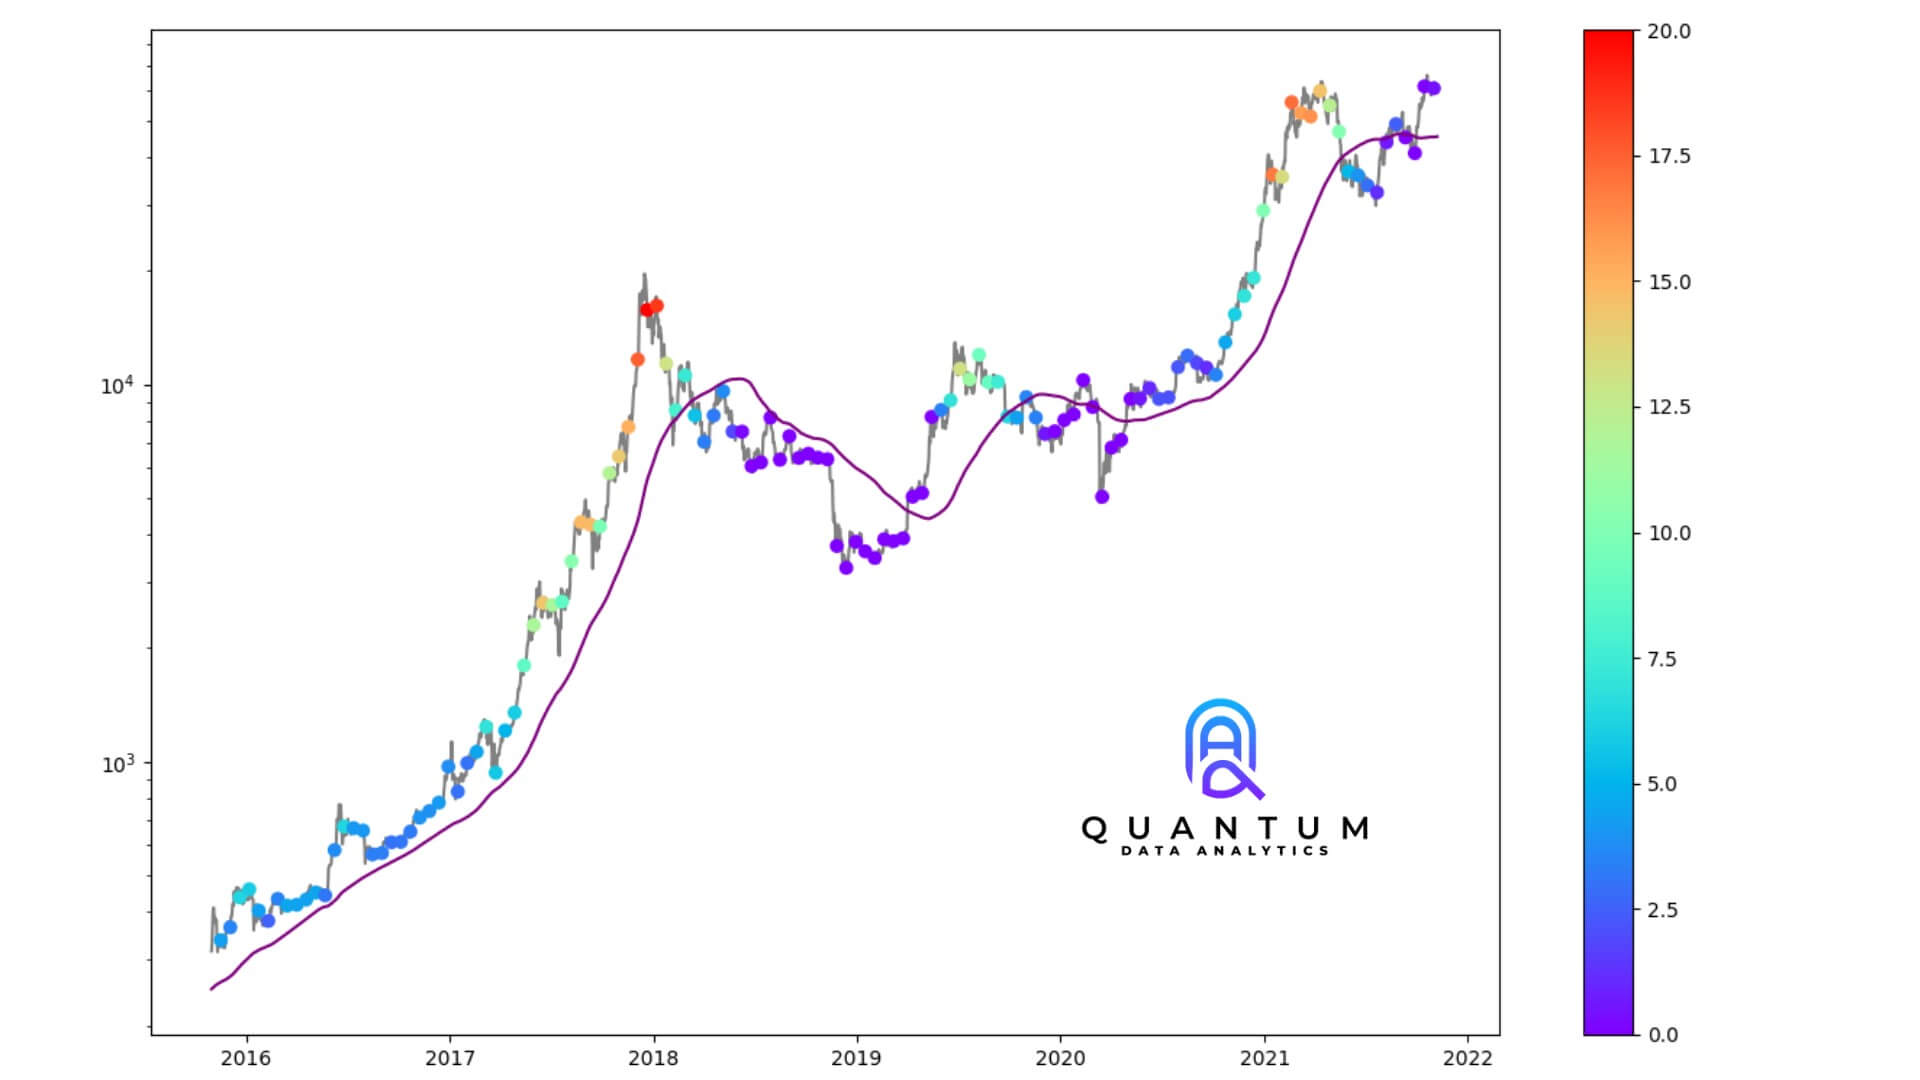
Trendlines are a fundamental aspect of market trading. It is no coincidence that prices ultimately revert to their average. With the help of artificial intelligence (AI), we can create forecasts that correlate with traditional moving averages and identify bull and bear markets more precisely. This gives us a significant advantage, as we can detect early when markets begin to shift within their cycles.
Regression Analysis
One Step Ahead of the Market
Regression analysis identifies and quantifies market trends and anomalies that might otherwise go unnoticed.
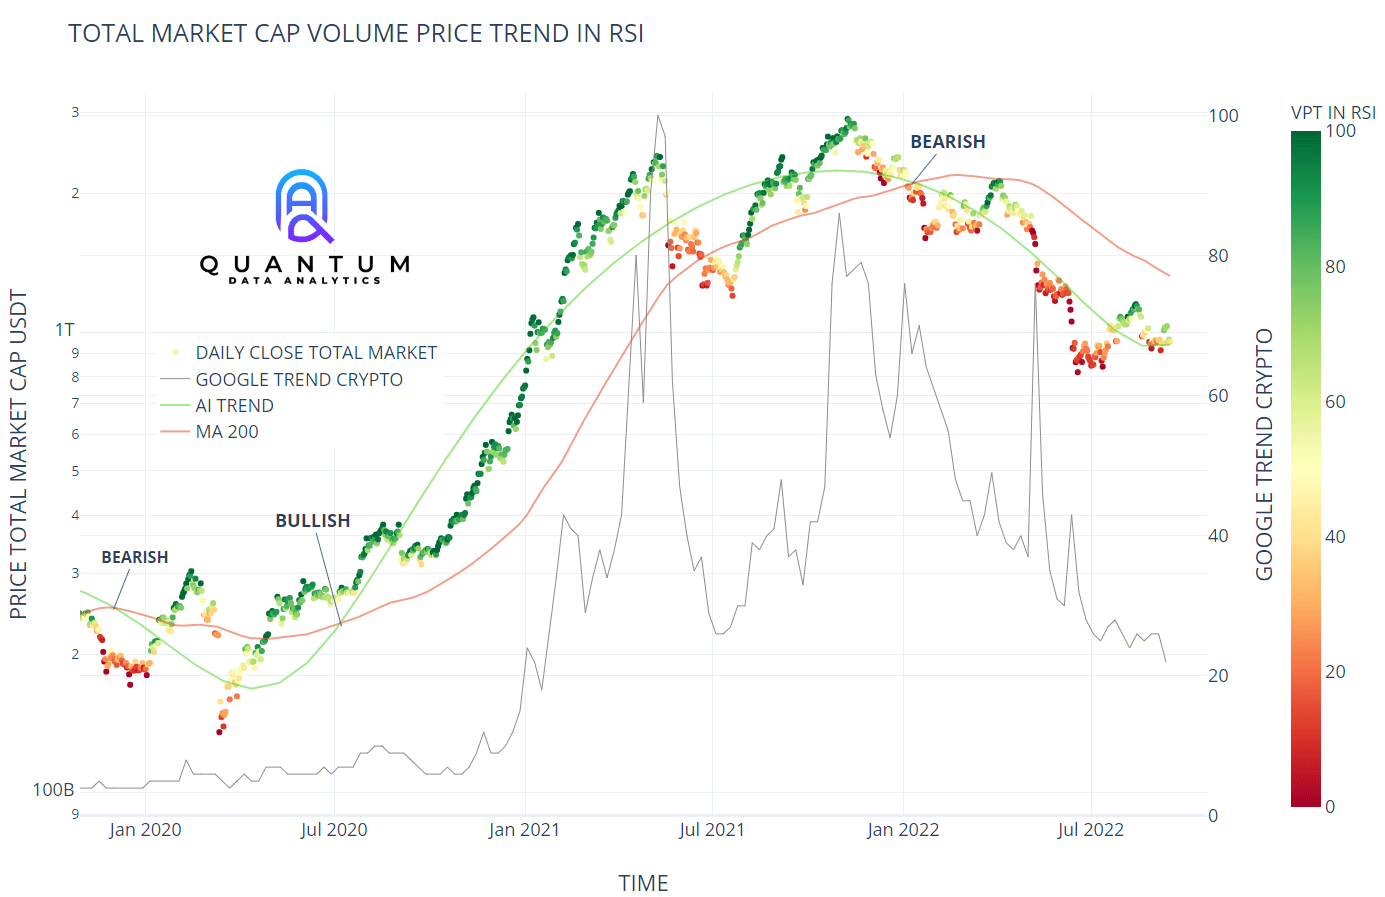
To obtain a consistent view of current developments in digital asset markets, cyclical seasonal patterns play a crucial role.
The key difference between traditional chart analysis and our regression-based approach lies in the graphical representation. While classical charts visualize price movements using so-called candlesticks, we present daily closing prices as data points, additionally differentiated by color. These color variations indicate when the market begins to shift based on underlying indicators.
“Advanced regression methods can deliver robust results, even when data are affected by noise or unforeseen events.”
– Erik Wimmer
Market Indicators
For our models, we use commonly applied trading indicators as well as macroeconomic data such as inflation, money supply, and sentiment analyses derived from social networks. The color-coded visualization illustrates the relationship between bullish and bearish factors. A balanced market sentiment is present when the indicator is positioned in the middle of the color scale. When the color indicators reach extreme values, this may indicate a potential trend reversal.
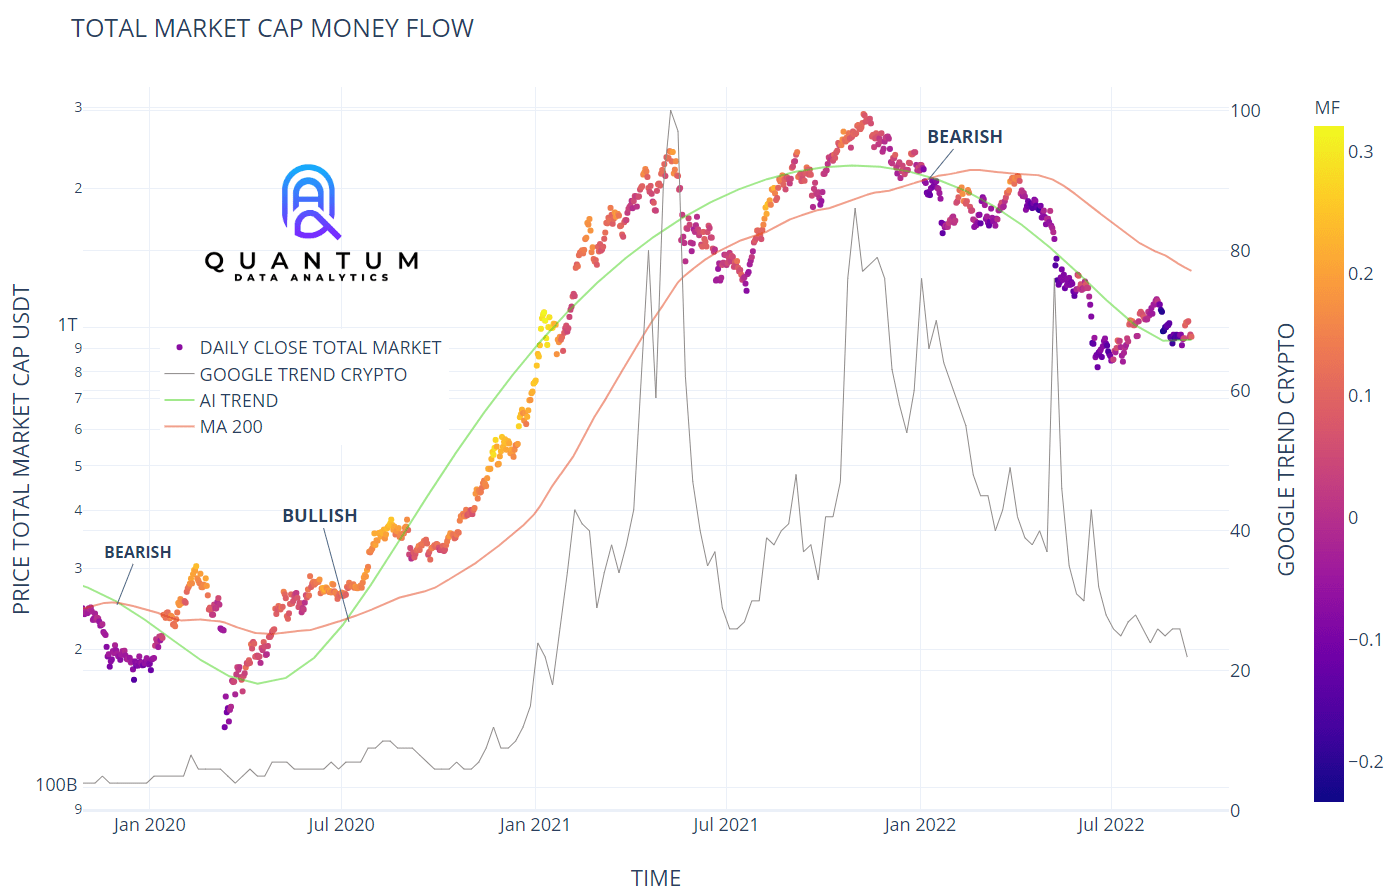
Price Zones

Price zones provide valuable insights into significant support and resistance levels. We identify these zones by analyzing the correlation between price, trading volume, and time. These areas are characterized by heightened trading activity, making them reliable indicators of when and where most traders realize gains or losses.
Price zones provide valuable insights into significant support and resistance levels. We identify these zones by analyzing the correlation between price, trading volume, and time. These areas are characterized by heightened trading activity, making them reliable indicators of when and where most traders realize gains or losses.
Market Depth
Market depth allows us to represent trading activity with significantly greater precision than conventional charts. It illustrates volume intensity and provides valuable insights into the volume at which price discovery occurs. Low and steadily declining volume can serve as an indicator of upcoming strong price movements.
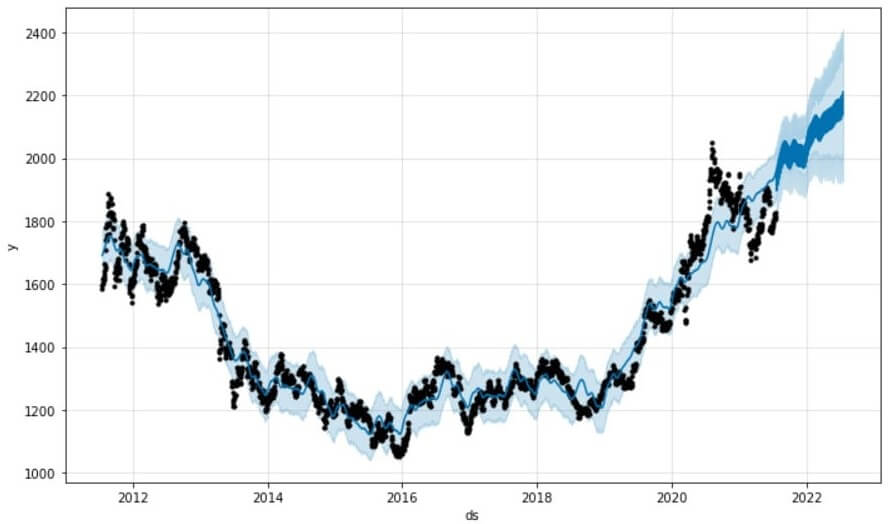
Time Series Analyses
Ahead of Time
Time series analyses enable the development and application of quantitative models that support precise forecasts and automated trading strategies.
To obtain a consistent view of current developments in digital asset markets, cyclical seasonal patterns are of particular importance.
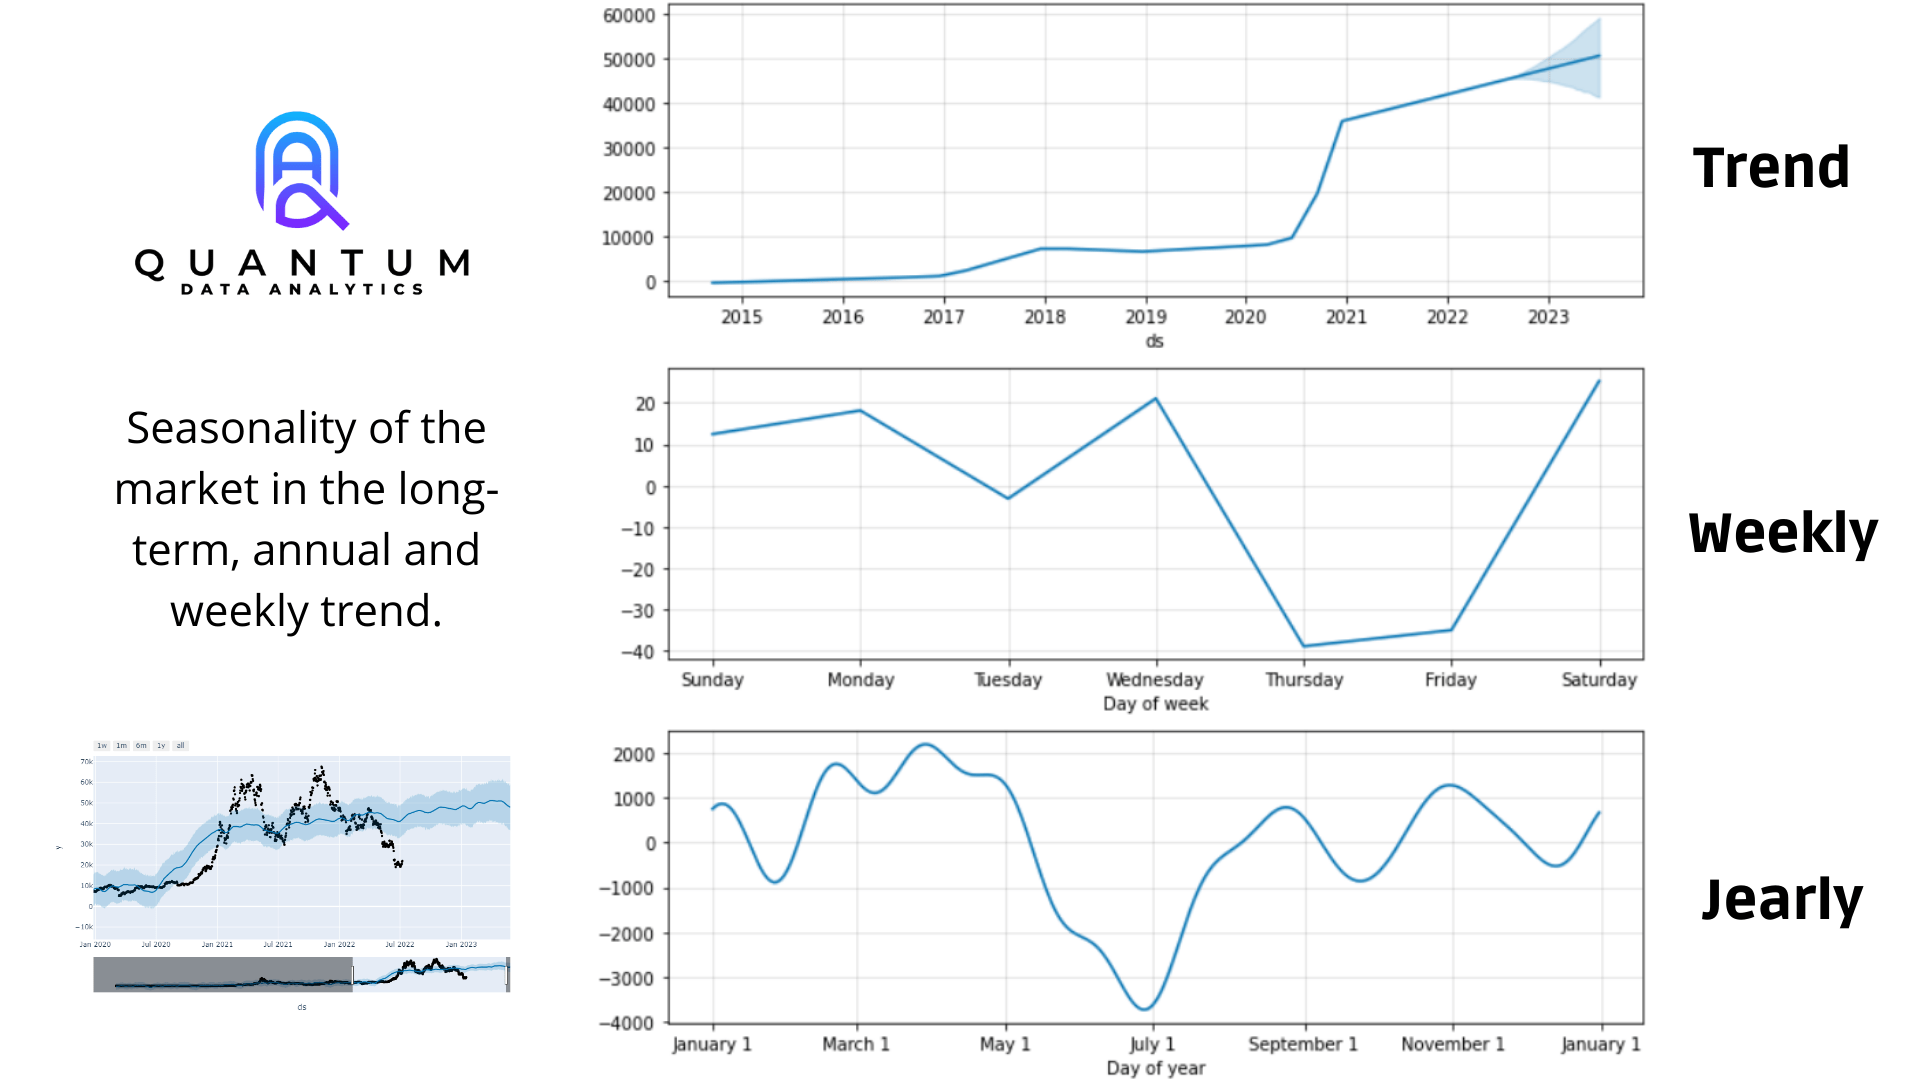
We analyze seasonality based on the overall trend, weekly cycles, and annual patterns. These insights are derived from quantitative averages that summarize the most probable developments. Deviations are examined in relation to market conditions and interpreted accordingly. Nevertheless, they provide valuable indications of how average behavior may evolve within a technical market environment.
“We analyze seasonality based on quantitative averages in order to provide valuable insights into the most probable developments within a technical market environment.”
– Erik Wimmer
Trend Channel
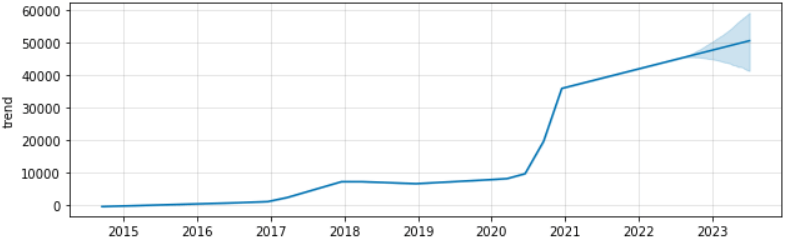
Trend development, together with its forecasting tools, provides valuable insights into potential market direction. This projection is based on comprehensive analyses of historical data and takes their average development into account. By applying proven statistical methods and modern analytical tools, our approach enables well-founded and highly reliable forecasts.
Weekly
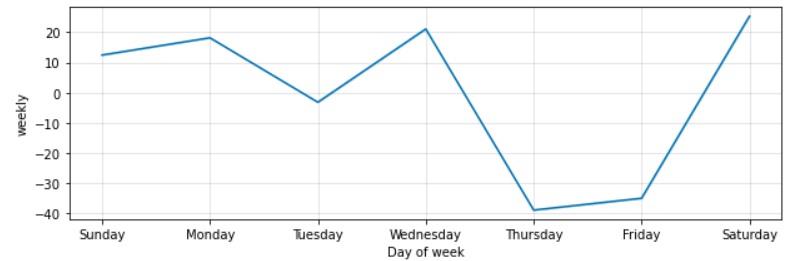
The weekly cycle illustrates the progression of trading activity from Monday to Sunday and its impact on price development. This representation allows both bullish and bearish market conditions to be identified, characterized by rising or falling prices and corresponding market dynamics. A key advantage of this analysis is the ability to develop targeted trading strategies and gain a deeper understanding of market behavior. This detailed perspective supports informed decision-making and enables sustainable long-term success.
Yearly
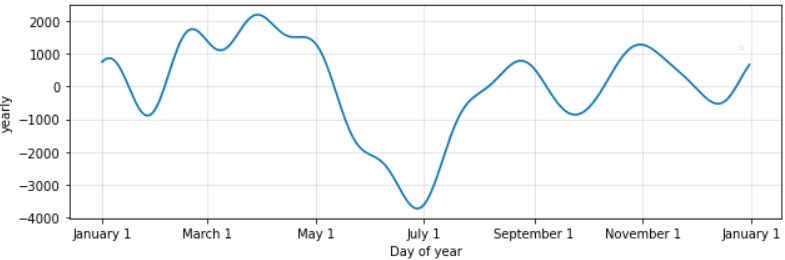
On an annual basis, we observe average monthly price movements from January to December and their cyclical patterns. In doing so, we identify both high-activity months and periods in which market participation declines. These fluctuations can be attributed to a variety of factors and analyzed from multiple perspectives. This helps us understand the significant role of seasonal effects and external influences. By systematically examining these cycles, we gain valuable insights and make well-founded decisions. This approach enables us to respond strategically to market developments and achieve long-term success.