


TECHNICAL
ANALYSES
IN FOCUS
Our ability to uncover patterns and correlations in large and complex datasets is a game changer for our market strategies.

Technical ANALYSES!
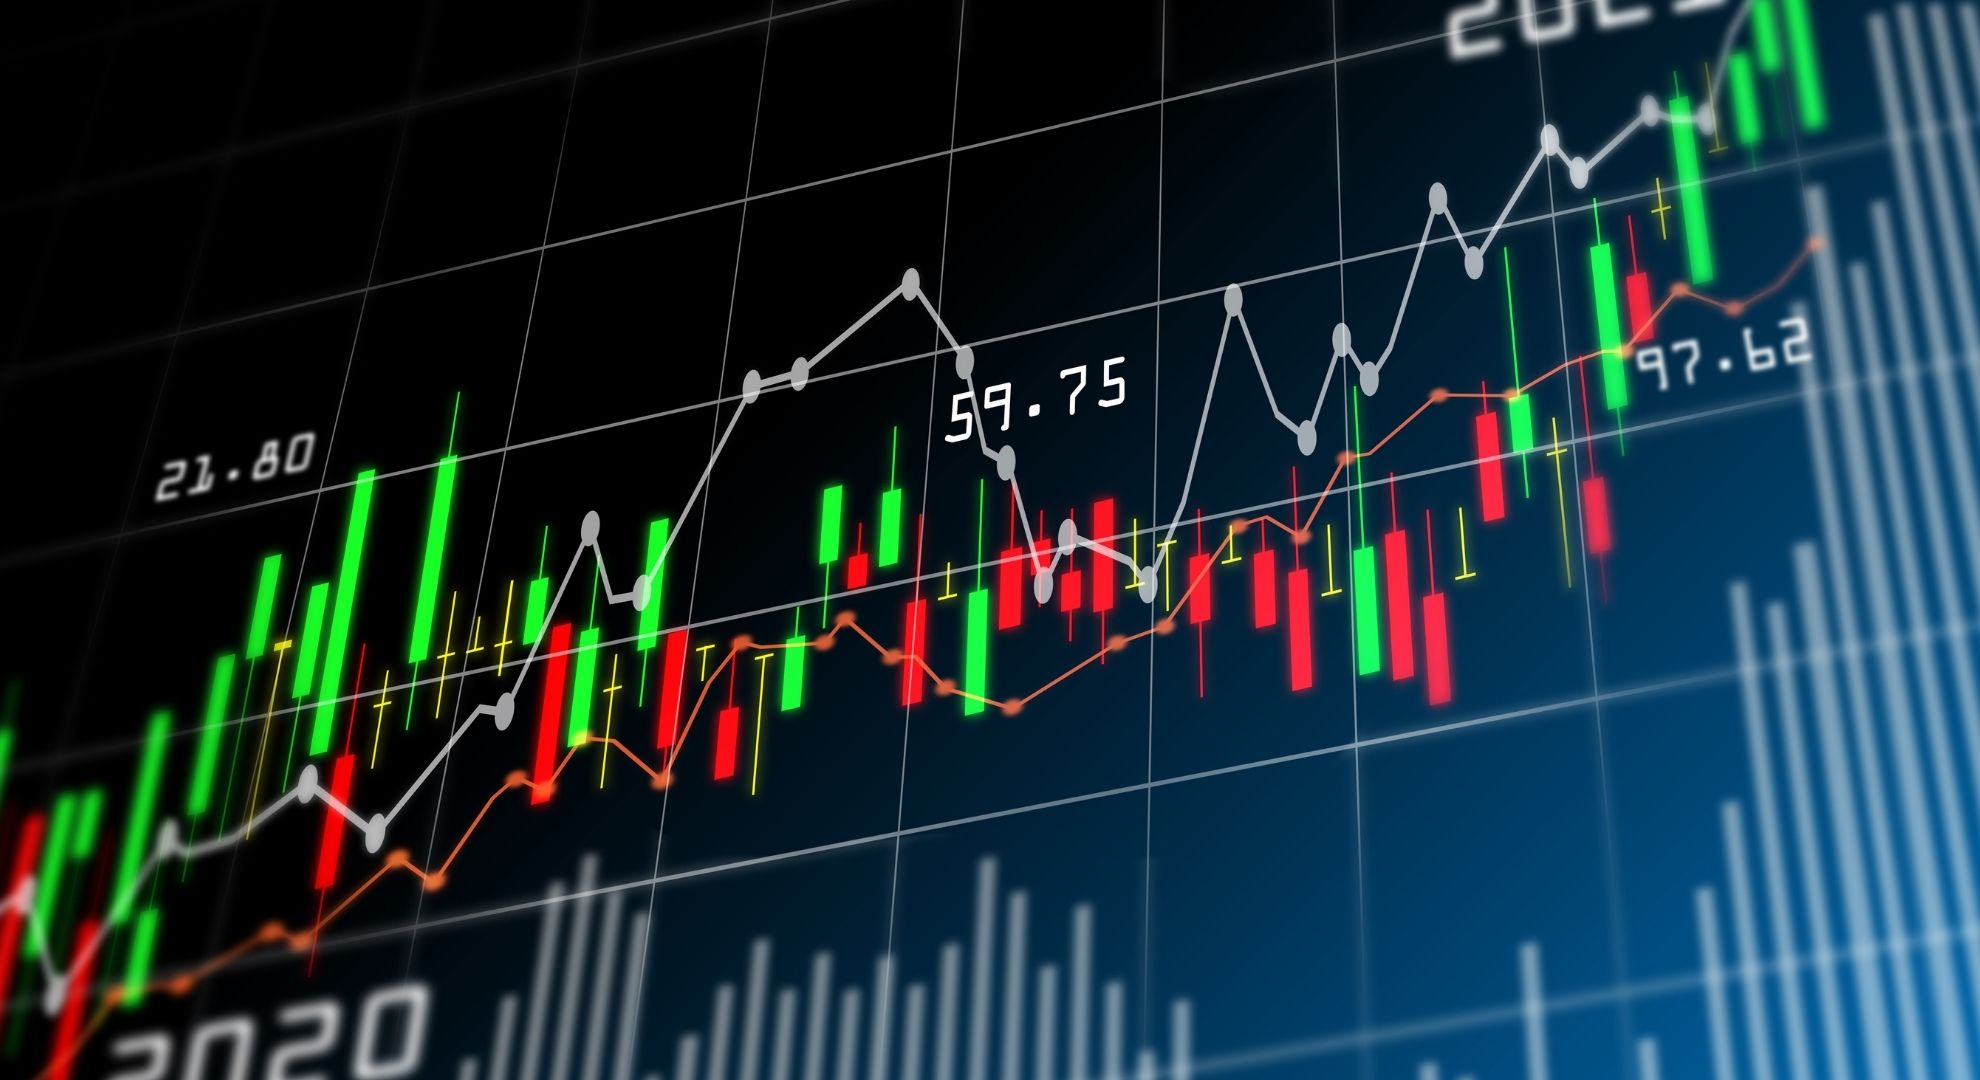
Classical chart analysis is an essential component of our overall market analysis.

Identifying trend directions in charts.
By using advanced chart analysis techniques, Quantum Data Analytics enables deeper insights into market dynamics in order to precisely identify critical turning points and trendlines.
At Quantum Data Analytics, we expand traditional chart analysis by integrating the latest regression analysis techniques. This advanced methodology allows us to create a more comprehensive and clearer picture of the current market situation. By combining regression analysis with time series analysis, we identify key features within charts, enabling us to detect support and resistance levels with greater precision. This analysis leads to meaningful price zones that indicate potential market opportunities and enable accurate forecasts. Our approaches are based on a broad range of indicators, which we precisely determine using artificial intelligence and seamlessly integrate into our market analyses.

Prices are not mere random events. By studying past price movements, we can identify patterns and trends that help us forecast future price developments.

2
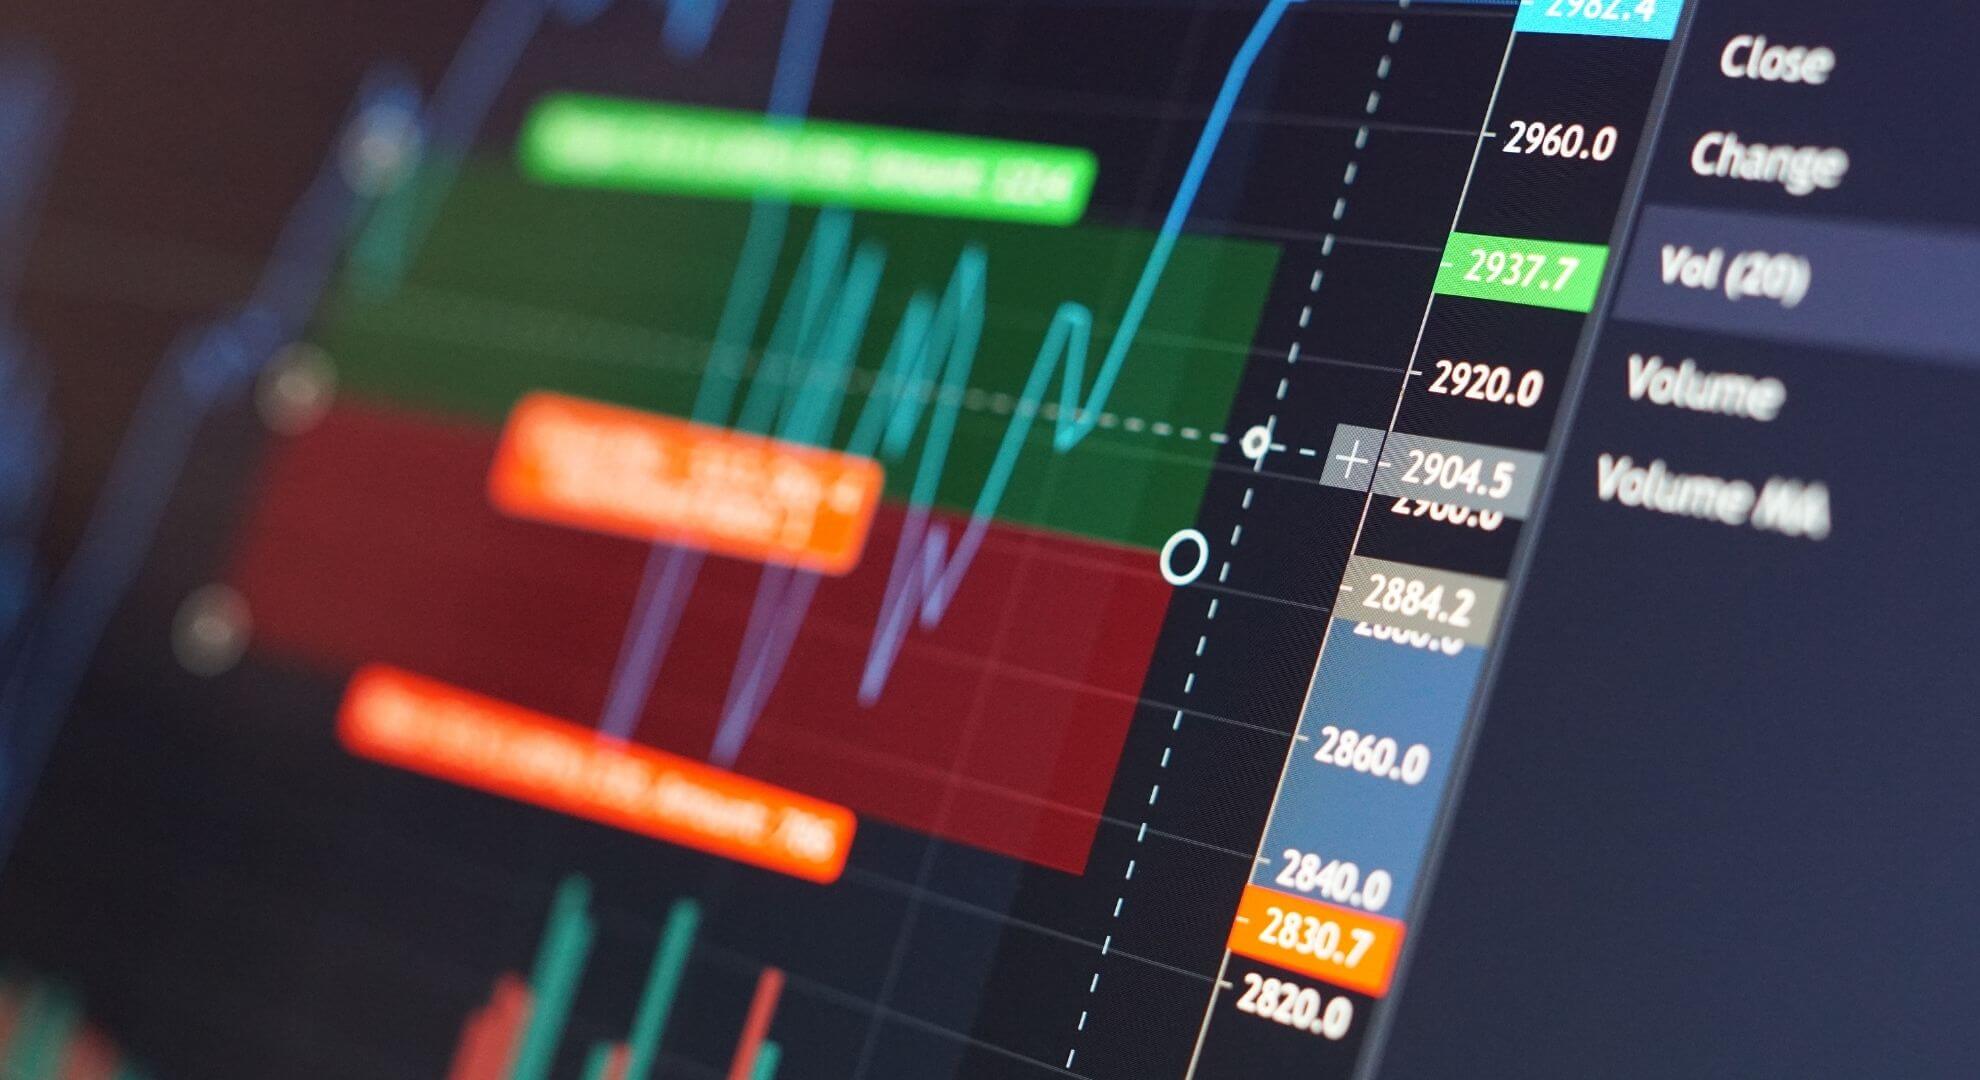
Price Zones
Support and resistance levels are highlighted. These price zones are of great importance, as they signal the highest trading activity. A longer stay within these zones may also indicate a possible trend reversal. By precisely identifying these zones, potential market movements can be forecast more effectively and trading strategies can be optimized. The price zones are color-coded and displayed as support zones (green) and resistance zones (red).

4
Indicators
For our trading activities, we use key indicators both in our analyses and in our trading bots—indicators that have proven their reliability and value in financial markets over many years. These include a wide range of momentum indicators as well as oscillators. To obtain real-time data, we have developed our own proprietary indicators, which are virtually indistinguishable from standard indicators in terms of trading signals. In addition, we use artificial intelligence to identify the most effective indicators depending on the current market situation.